
At a certain point, it becomes imperative to leverage data to run a successful business. That’s where retail sales analytics comes in. What are retail store analytics, and how can they make such a big difference, anyway?
Use this guide to understand retail sales analytics and how sales reporting and metrics can help you build a better business.
Key Takeaways:
- Retail store analytics use data to understand sales trends, customer behavior, and inventory levels.
- Key performance indicators like sales per square foot and inventory turnover are essential for retail management.
- A comprehensive POS system like KORONA POS makes running all the retail store analytics from within your POS system easy.
What Is Retail Sales Analytics and Why It Matters
At the most basic level, retail analytics uses data to understand, measure, and improve a retail business’s performance. This data-driven approach helps retailers understand sales trends, customer behavior, and inventory levels.
Monitoring key performance indicators (KPIs) such as sales per square foot, inventory turnover, and customer traffic patterns is one way to leverage data to manage a retail store efficiently.
10 Types of Retail Analytics and Their Use Cases
Retail analytics can be categorized into various types, each providing valuable insights to enhance store operations, customer experience, and profitability:
Type #1: Sales Analytics
Sales analytics examines sales data to identify trends, measure performance, and forecast future sales. Analyzing seasonal patterns, product popularity, and sales channels helps retailers optimize pricing strategies, promotions, and inventory management to maximize revenue.
One fundamental metric derived from sales analytics, often quantified by a sales growth calculator, is the percentage increase in revenue over time.
Type #2: Customer Analytics
Customer analytics involves studying customer behavior, preferences, and demographics. This helps retailers understand their target audience, personalize marketing efforts, and improve customer retention.
Type #3: Inventory Analytics
Inventory analytics tracks inventory levels, turnover rates, and trends to ensure optimal stock management. This type of analytics helps retailers avoid stockouts or overstocking, reduce carrying costs, and improve order fulfillment.
Type #4: Marketing Analytics
Marketing analytics evaluates the effectiveness of marketing strategies and campaigns. Retailers can optimize their marketing efforts by analyzing conversion rates, customer acquisition costs, and return on investment (ROI).
Type #5: Operational Analytics
Operational analytics involves analyzing staffing, scheduling, and store layout data. This approach can help retailers reduce costs, improve employee productivity, and enhance the shopping experience.
Discover Advanced Analytics and Custom Reports
Speak with a product specialist and learn how KORONA POS can power your business needs.
Type #6: In-Store Analytics
In-store analytics track retail locations’ customer behavior, foot traffic, and dwell time. By analyzing movement patterns and engagement hotspots, businesses can optimize store layouts, improve product placement, and enhance the shopping experience.
Type #7: Merchandise Analytics
Merchandise analytics provide insight into product performance, inventory turnover, and stock levels. These metrics help businesses identify top-selling items, manage inventory more strategically, and make informed pricing, promotions, and product assortment decisions.
Type #8: Web Analytics
Web analytics track online visitor behavior, page views, conversion rates, and customer journeys. For businesses with an online presence, this data helps optimize the user experience, targeted marketing campaigns, and improved e-commerce sales.
Type #9: Demand Forecasting
Demand forecasting uses historical sales data, seasonality, and market trends to predict future customer demand. Accurate forecasting helps businesses plan inventory, staffing, and production schedules.
Type #10: Sales Forecasting
Sales forecasting estimates future revenue based on historical data, current market conditions, and sales trends. It helps businesses set realistic goals, allocate resources effectively, and plan for growth.
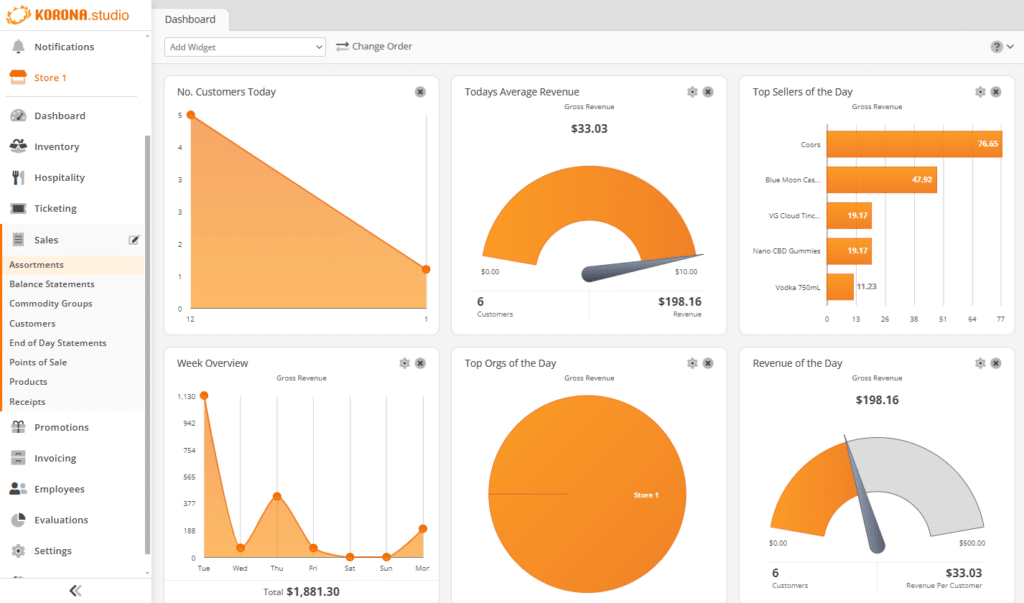
Type #11: Business Intelligence (BI) Reports
BI reports consolidate data from multiple sources into actionable insights through dashboards and visualizations. They help businesses monitor key performance indicators (KPIs), uncover trends, and make data-driven decisions.
Retail Sales Analytics Reports: Examples You Should Track
Below is an in-depth look at the specific retail sales analytics reports that can transform retail performance and maximize your profits:
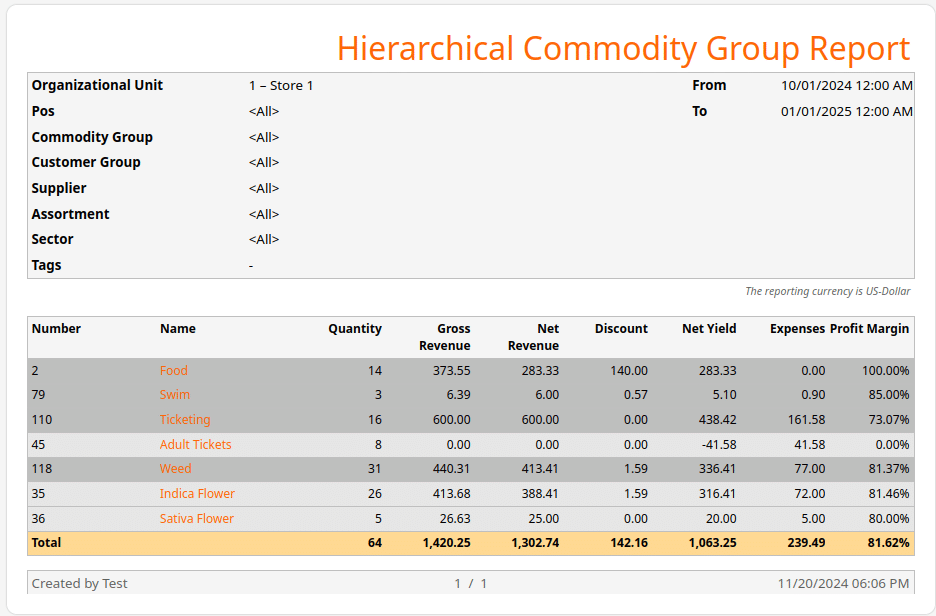
Hierarchical Commodity Group Report
The hierarchical commodity group report analyzes product categorization across multiple levels of hierarchy, breaking down merchandise into parent and child categories. It provides insights into product performance, sales distribution, and inventory management by examining relationships between different product groups and their subcategories.
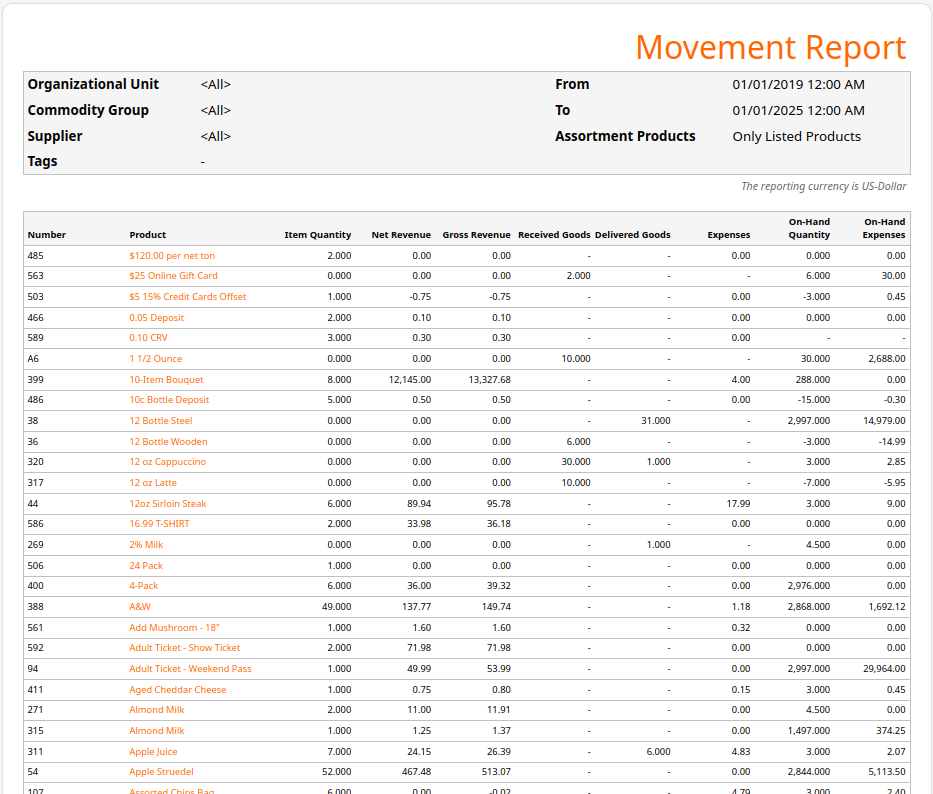
Movement Report
The movement report tracks product inventory movement, capturing transfers, sales, and stock adjustments. It highlights product flow through the supply chain, identifies trends in stock rotation, identifies slow-moving items, and provides visibility into inventory dynamics and operational efficiency.
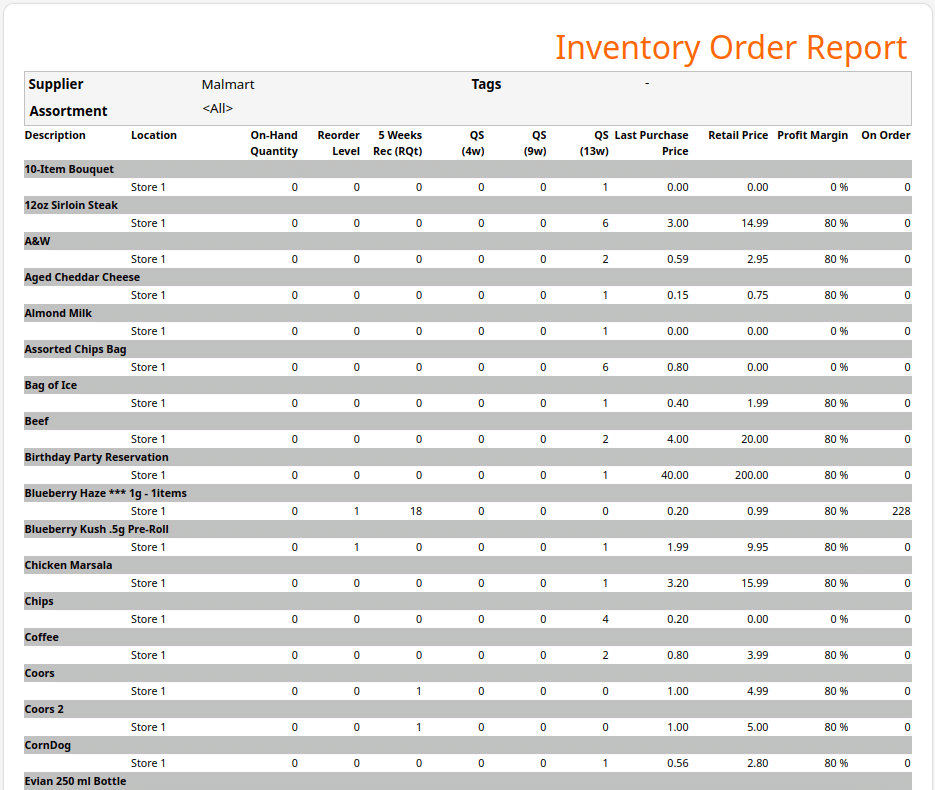
Inventory Order Report
Inventory order reports monitor procurement processes, tracking order quantities, frequencies, and supplier performance. They help optimize inventory levels, reduce stockouts, manage reorder points, and evaluate vendor reliability by analyzing purchasing patterns and inventory replenishment strategies.
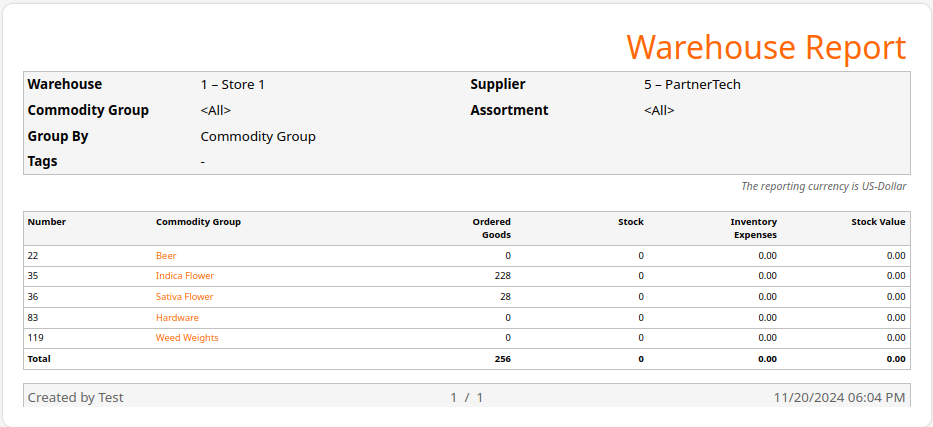
Warehouse Report
A warehouse report provides an overview of warehouse operations, including storage utilization, picking efficiency, receiving processes, and space management. It helps optimize logistics, track inventory accuracy, analyze storage costs, and improve warehouse performance and inventory control.
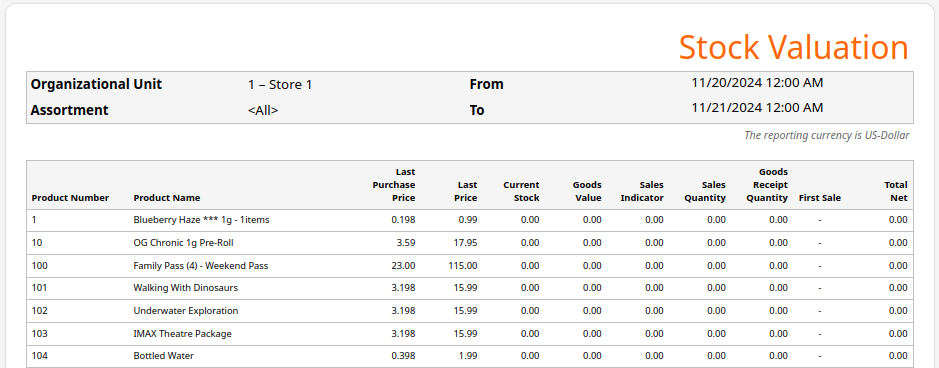
Stock Valuation
Stock valuation calculates current inventory value using various accounting methods like FIFO, LIFO, or weighted average. It’s paramount for financial planning by determining asset worth, tracking inventory investment, assessing potential write-offs, and supporting strategic stock-management decisions.
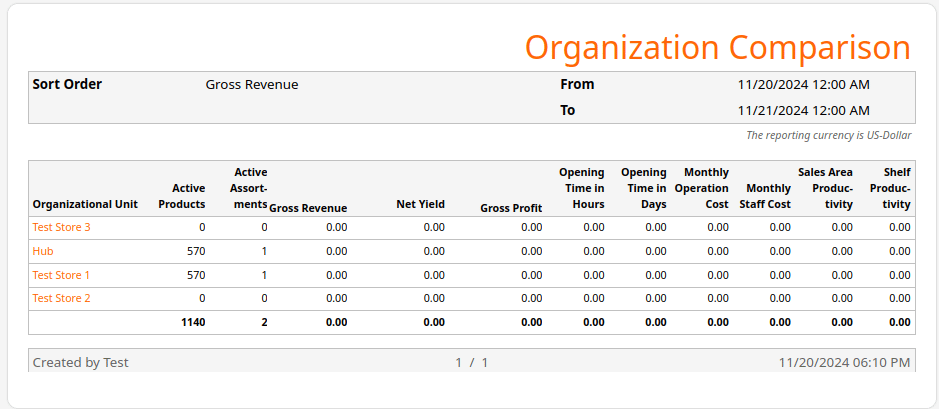
Organization Comparison
Organization comparison benchmarks performance across different organizational units, stores, or departments. These metrics enable comparative analysis of sales, profitability, gross profit, and operational metrics to identify best practices, highlight areas for improvement, and support strategic resource allocation.
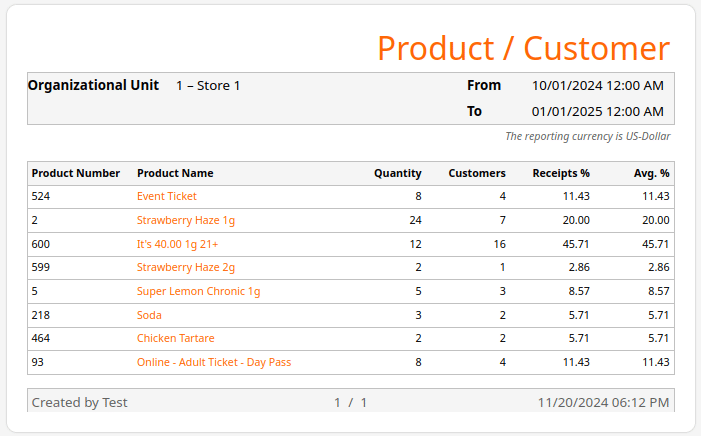
Product / Customer Report
The product/customer report links product performance with customer purchasing behavior, analyzing buying patterns, preferences, and correlations between specific products and customer segments. It supports targeted marketing, personalized recommendations, and inventory optimization strategies.
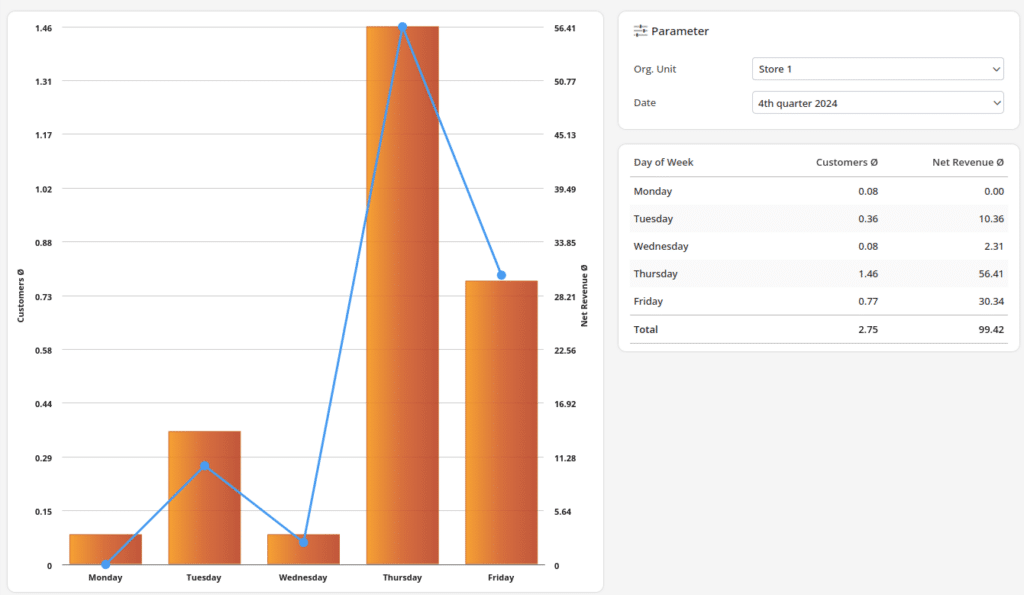
Customers per Day of Week Report
Customers per day of week report analyzes customer traffic trends by day of the wseek reveals peak shopping periods. Retailers can leverage this insight to adjust staffing, inventory, promotions, and marketing strategies.
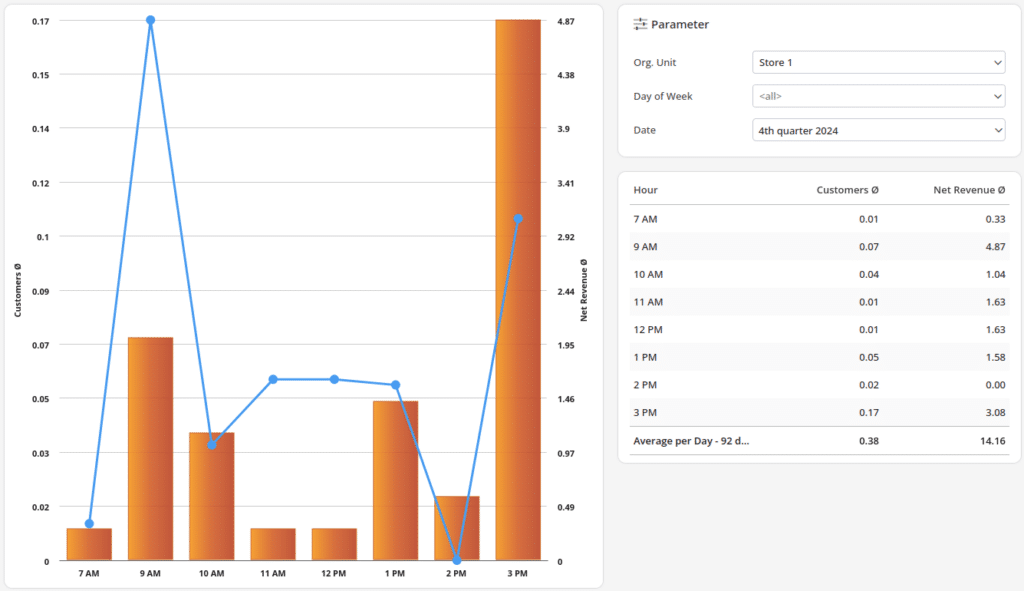
Customers per Hour Report
Customers per hour report examines hourly customer traffic and sales patterns. Retailers can use this data to optimize staff schedules, reduce wait times. These adjustments lead to a smoother shopping experience and higher revenue during peak hours.
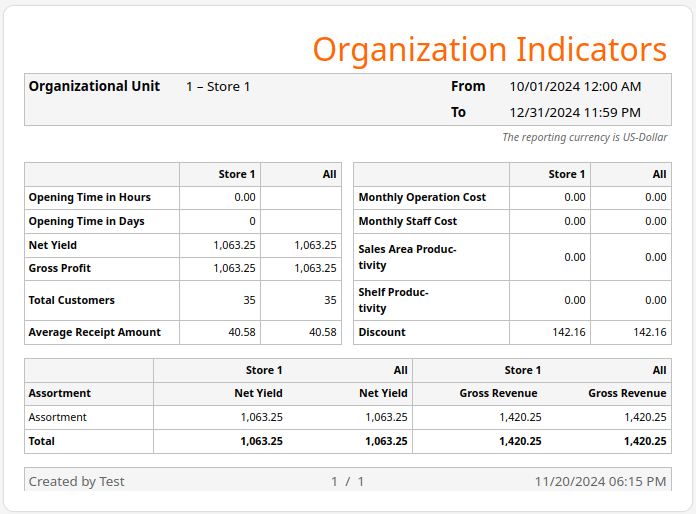
Organization Indicators Report
Organization indicators report aggregates key performance indicators (KPIs) across the organization, providing a holistic view of business health. It tracks metrics like monthly operation cost, profitability, sales area productivity, average receipt amount, and efficiency.
How Retail Sales Analytics Help Improve Store Performance? The Benefits
Retail sales analytics enhances store performance by providing actionable insights into sales trends, customer preferences, and inventory management. Key benefits include:
Benefit #1: Smarter Customer Segmentation
Analytics allow stores to group customers based on buying habits, preferences, and demographics. For example, identifying frequent shoppers who prefer eco-friendly products enables more targeted marketing campaigns.
Benefit #2: Faster Restocking and Inventory Optimization
Real-time sales data shows which products are selling quickly and which are not. For instance, a spike in sneaker sales triggers faster restocking. This prevents overstocking slow-moving items and makes sure shelves are filled with what customers actually want.
Benefit #3: Enhanced Staff Productivity and Task Automation
Analytics automate tasks like sales tracking and stock alerts, freeing staff from manual counts and reporting. With dashboards showing which aisles need attention, employees can prioritize tasks more efficiently.
Benefit #4: Better Pricing Strategies
Retail analytics reveal how price changes impact sales volume. If a small discount boosts sales significantly, stores can use that information to adjust pricing and maximize profits. This helps businesses maintain competitiveness, protect margins, and stay proactive on market trends.
Benefit #5: Improved Visual Merchandising
Retailers can design layouts that drive more purchases by analyzing which displays attract the most sales. For instance, moving high-demand items to eye-level based on foot traffic data increases visibility and boosts impulse buys.
Inventory management a headache?
KORONA POS makes stock control easy. Automate tasks, generate custom reports, and learn how you can start improving your business.
Retail Data Analysis Tips to Get the Most Out of Your Data
Leveraging retail analytics effectively can significantly enhance your store’s performance. Here are some tips to maximize the value of your data and turn insights into actionable strategies for growth and efficiency.
Tip #1: Set Clear Objectives
Define specific goals for your analytics efforts. Whether it’s improving sales, optimizing inventory, or enhancing customer experience, having clear objectives helps you focus on the most relevant data and measure success accurately.
Tip #2: Use Real-Time Data
Utilize real-time data to make timely decisions. Real-time analytics provide up-to-date insights, allowing you to respond quickly to changing market conditions, customer preferences, and sales trends, ensuring you stay ahead of the competition.
Tip #3: Integrate Multiple Data Sources
Combine data from various sources, such as POS systems, CRM software, and online sales platforms. Integrating multiple data sources provides a comprehensive view of your business, enabling more accurate analysis and better decision-making.
Tip #4: Invest in the Right Tools
Choose the best retail management software and analytics tools for your needs. Advanced tools can automate data collection, analysis, and reporting, making it easier to uncover insights and implement strategies effectively.
Tip #5: Train Your Team
Ensure your team is well-versed in using analytics tools and interpreting data. Providing point of sale training and resources helps employees understand the value of data-driven decisions and encourages them to leverage analytics in their daily operations.

KORONA POS has been a huge game changer for my overall profitability. Implementation was seamless and painless! The support staff is great and always ready to help. Had I known it would be this easy, I would have made the switch sooner!
-Kristen L.
How to Choose the Right Retail Sales Analytics Tool
The right retail sales analytics software is vital for enhancing store performance and gaining valuable insights. Here are key features to ensure you choose a solution that meets your business needs, from retail inventory management to the best retail POS system.
Feature #1: Real-Time Reporting
Real-time reporting is essential for making immediate, data-driven decisions. This feature provides up-to-date insights into sales trends, inventory levels, and customer behavior, allowing you to respond quickly to changes and optimize your strategies accordingly.
Feature #2: Integration Capabilities
Ensure the software integrates seamlessly with your existing systems, such as POS, CRM, and inventory management platforms. Strong integration capabilities streamline data collection and analysis, providing a comprehensive view of your business operations and enhancing retail inventory management.
Feature #3: Customizable Dashboards
Customizable dashboards allow you to tailor the analytics interface to your specific needs. This feature lets you focus on the most important metrics and retail KPIs, making it easier to monitor performance and quickly identify areas for improvement.
Feature #4: Advanced Analytics Tools
Look for software that offers advanced analytics tools, such as predictive analytics and machine learning. These tools can help you forecast sales trends, optimize inventory levels, and personalize marketing strategies, providing a competitive edge.
Feature #5: User-Friendly Interface
A user-friendly interface ensures your team can easily navigate and utilize the software. Intuitive design and easy-to-understand reports make it simpler for employees to leverage the data and make informed decisions, improving overall efficiency and productivity.
Get started with KORONA POS today!
Explore all the features that KORONA POS has to offer with an unlimited trial. And there’s no commitment or credit card required.
Necessary Retail Analytics Tools
From POS systems to business intelligence dashboards, each retail analytics tool plays a vital role in a business’s health. Here’s a look at the essential retail operations software and tools every retailer should consider:
Tool #1: POS Systems
Modern POS systems track sales trends, inventory levels, and customer data in real-time. A robust retail POS system like KORONA POS helps businesses monitor performance and make smarter decisions quickly.
Tool #2: Business Intelligence (BI) Platforms
BI tools visualize data through dashboards and reports, making complex analytics easy to understand. They integrate data across departments, uncover trends, and guide strategy, but they can take some adapting to.
Tool #3: Inventory Management Software
The best inventory management software automates stock tracking, predicts reorder points, and highlights inventory discrepancies. It ensures the right products are available without overstocking.
Tool #4: Customer Relationship Management (CRM) Systems
CRMs collect and analyze customer interactions, helping businesses build loyalty programs, personalize promotions, and identify top customer segments for targeted marketing campaigns.
Retail Sales Analytics vs. General Retail Analytics
While both types of analytics are important, retail sales analytics and general retail analytics serve different purposes. Here’s how:
Retail Sales Analytics:
- Focus: Sales trends, revenue growth, & product performance
- Metrics: Conversion rates, average transaction value, best-sellers, etc.
- Goal: Directly increase store revenue and profitability
- Example: Using real-time sales data to optimize product pricing
General Retail Analytics:
- Focus: Entire retail operations (marketing, staffing, logistics)
- Metrics: Customer satisfaction, marketing ROI, inventory turnover
- Goal: Improve the overall retail experience and operational efficiency
- Example: Analyzing marketing campaign effectiveness in bringing foot traffic
KORONA POS: Using Retail Sales Analytics to Turn Data Into Revenue
Retail sales analytics is your blueprint for smarter, faster business decisions. By interpreting customer behaviors, sales trends, and inventory patterns, retailers can directly boost profitability.
Don’t just collect data—act on it. Start by upgrading your tech stack with the right retail operations software and explore how cloud-based POS system like KORONA POS can transform your store.
Get started with KORONA POS today!
Explore all the features that KORONA POS has to offer with an unlimited trial. There’s no commitment or credit card required.
FAQ: Retail Store Analytics
What is data analytics in retail?
Data analytics in retail involves collecting and analyzing customer, sales, and inventory data to uncover trends, improve operations, and enhance the shopping experience.
Why should retailers use analytics?
Retailers should use analytics to better understand customer behavior, optimize inventory management, boost sales performance, and make smarter, data-driven business decisions.
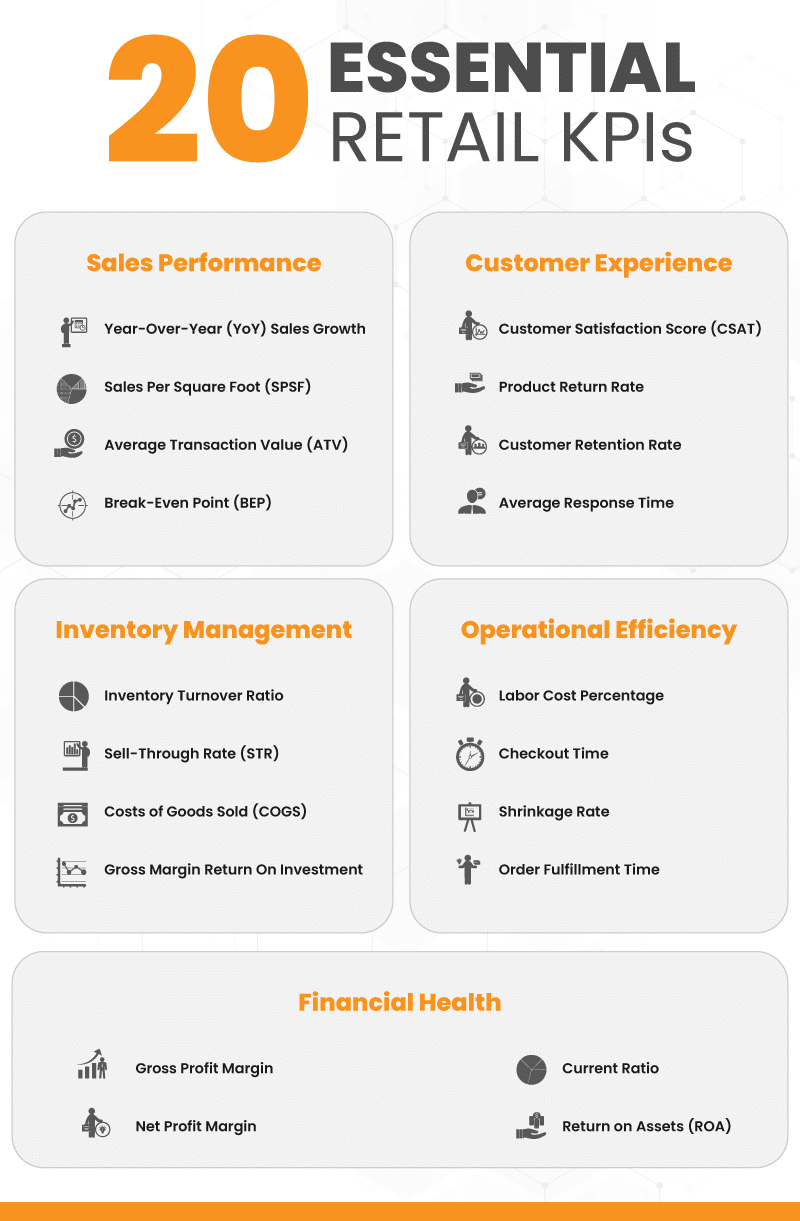
What KPIs should I track in retail sales analytics?
Key KPIs to track include sales per square foot, conversion rate, average transaction value, customer retention rate, and inventory turnover ratio.
How can small businesses use retail sales analytics?
Small businesses can use retail analytics to spot best-selling products, personalize marketing efforts, manage inventory efficiently, and identify growth opportunities with minimal investment.


