


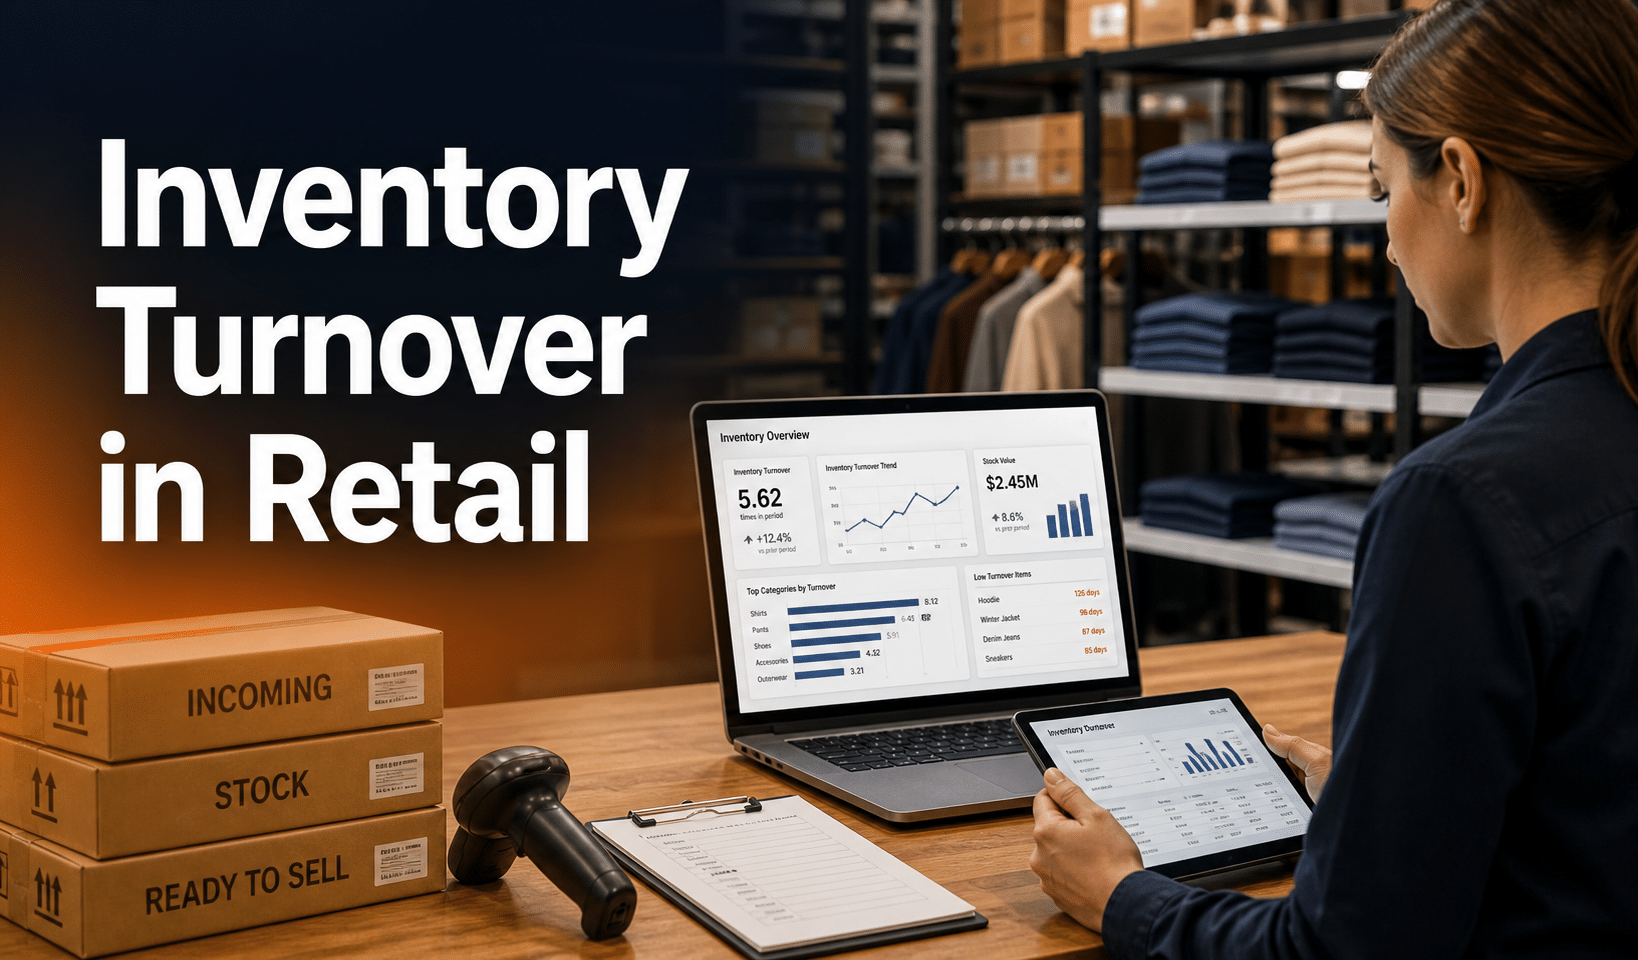
Inventory turnover in retail tells you how many times you sell through and replace your stock in a year. It decides how much of your cash sits on the shelves instead of in your bank account. Many retailers calculate it wrong, then compare the result against a benchmark built for a different kind of store.
Below you will find the correct formula, why the cost of goods sold beats sales in the numerator, turnover benchmarks by store type, and what to do when your numbers run too low or too high.
Key Takeaways:
- Calculate turnover with cost of goods sold, not sales, or your ratio comes out inflated by the width of your gross margin.
- No universal target exists, so judge your number by your own category and ignore broad retail averages.
- A store-wide figure hides the real problem, because a healthy blend can cover a department sitting for months.
- Speed says nothing about earnings, so check gross margin return on inventory before you cut a slow seller.
What Is Inventory Turnover in Retail?
Inventory turnover in retail is the number of times a store sells through and replaces its average inventory during a set period, usually one year. A store at 6 turns sold and restocked the value of its entire stockroom six times over twelve months.
The metric goes by several names. Stock turnover, inventory turns, merchandise turnover, and stockturn all describe the same calculation. Whichever label your accountant or your POS report uses, the question behind it stays the same: how long does a dollar sit on your shelf before it becomes a dollar in your register?
That framing matters more than the accounting definition. For most independent retailers, inventory is the largest asset on the books and the biggest claim on working capital.
Carrying it is not free either, since holding costs across retail typically run 20% to 30% of inventory value per year once storage, insurance, shrink, and tied-up capital are counted. Every turn releases cash you can redirect toward new stock, payroll, or retail profitability work. Every stalled turn locks that cash in place.
Your rate sharpens decisions across six areas of retail inventory management: purchasing, costing, ordering, cash flow, margins, and storage.
You can measure turnover annually, quarterly, monthly, or by season. Shorter windows help with seasonal assessment, but keep the time frame identical across all the figures you intend to compare.
Inventory management a headache?
KORONA POS makes stock control easy. Automate tasks, generate custom reports, and learn how you can start improving your business.
How To Calculate Inventory Turnover in Retail
Divide your cost of goods sold by your average inventory for the same period. The result is your turns for the period.
The Inventory Turnover Formula
Which inventory turnover formula should you use?
Two versions circulate, and they give meaningfully different answers for the same store.
It measures volume at cost on both sides of the division, so your margin does not inflate the result.
Sales include your markup, so a higher margin can push the number up and overstate turnover.
BOTTOM LINE
Both appear in published benchmarks, and the two produce meaningfully different answers for the same store. Lead with the COGS version. It measures volume at cost on both sides of the division, so your margin does not inflate the result.
How To Find Your Average Inventory
To calculate average inventory, add your beginning and ending inventory for the period, then divide by 2.
Average inventory matters because the value of your stock swings hard across a year. A single snapshot taken the week after a large buy tells you almost nothing. For sharper results, take additional measurements at several points in the period, add them together, and divide by the number of counts you completed. Twelve-month-end balances beat a two-point average by a wide margin.
Stores running dynamic pricing should pay particular attention here, since valuation shifts with each price change.
COGS or Sales: Which Numerator To Use
Using sales instead of COGS inflates your turnover by the size of your gross margin. A retailer at a 25% margin will report a turnover about a third higher on a sales basis than on a cost basis, from identical operations.
The distortion explains why published benchmarks contradict each other so violently. Depending on which article you land on, a general retailer is told to target four to six turns, five to ten turns, or nearly eleven. Financial aggregator CSIMarket illustrates the mechanism directly: for the twelve months to Q2 2026 it placed the whole US retail sector near 13x on a cost-of-sales basis and about 15x on a sales basis. One sector, one period, two different answers.
Two rules keep you out of trouble:
- Use COGS whenever you plan to compare your result with an industry benchmark or another store.
- Whichever you pick, apply it consistently and record which one you used.
Cost of goods sold takes the beginning inventory for your reference period, adds production costs and new purchases, then subtracts whatever inventory remains at the end. For retailers who buy finished goods from a wholesaler, COGS is simply what you paid for the items.
Businesses that use labor to build or finish a product must add that labor plus any additional materials. Rent, sales costs, retail marketing spend, and equipment stay out of the number. Your retail accounting method determines how you value what remains.
Inventory Turnover Example for a Liquor Store
Take a liquor store that sells $1.5 million in products for the year and carries $500,000 in average inventory at cost. At a 25% gross margin, its COGS lands at $1,125,000.
- Sales basis: $1,500,000 ÷ $500,000 = 3.0 turns
- COGS basis: $1,125,000 ÷ $500,000 = 2.25 turns
The honest answer is 2.25. Both results sit far below the six to eight turns that liquor store operators should target, which points to a store carrying too much stock. Demand is not the problem here.
PRO TIP
Run the math backward to size the gap. Hitting six turns on the same $1,125,000 of COGS would require average inventory of $187,500. The store carries $312,500 more than its sales volume justifies. That is the practical value of the metric: it converts a vague sense of an overstuffed backroom into a dollar amount you can work with.
How To Convert Inventory Turns Into Days on Hand
Days on hand tells you how long the average item sits on your shelf before someone buys it. Turns and days describe the same behavior from opposite ends: turns count the cycles, days count the wait.
Divide 365 by your turnover ratio, and you have your answer in days. Accountants call the same metric days inventory outstanding, shortened to DIO.
Run our liquor store through it:
At the six-turn target: 365 ÷ 6 = 61 days on hand, close to two months
At its actual 2.25 turns: 365 ÷ 2.25 = 162 days on hand, or just over five months of stock
Most operators reason better in days. Five months of merchandise on the floor is something you can picture, while 2.25 stays abstract.
Our inventory turnover calculator runs both conversions for you.
What Is a Good Inventory Turnover Ratio in Retail?
No single ratio works across retail. Benchmarks range from roughly 1.3x in aftermarket auto parts to 20x in grocery and convenience, according to AisleStock’s 2026 analysis of named-retailer 10-K filings, so a target borrowed from the wrong category will mislead you badly.
Two distortions trip up retailers reading benchmark content. The first is the numerator problem covered above. The second is composition: sector-wide retail averages are weighted toward grocery and discount chains with enormous velocity. A gift shop owner who reads a 13x average and panics is measuring a curated assortment against Costco.
Anchor to your own category.
Inventory Turnover Benchmarks by Retail Category
Figures below are annual turns on a cost basis. Days on hand derive from 365 divided by each end of the range.
| Retail category | Typical annual turns | Approximate days on hand | What drives the pace |
|---|---|---|---|
| Convenience (in-store merchandise) | 10 to 15 | 24 to 37 | Grab-and-go traffic, packaged beverages, short-dated foodservice |
| Grocery and supermarket | 12 to 20 | 18 to 30 | Perishables force weekly replenishment cycles |
| Warehouse club and discount | 9 to 13 | 28 to 40 | High volume, narrow assortment, tight buying discipline |
| Liquor, beer, and wine | 6 to 8 | 45 to 60 | Long shelf life and deep SKU counts let premium bottles linger |
| Smoke and vape | 4 to 8 | 45 to 90 | Consumables move quickly while hardware and glass sit |
| Health, supplements, and CBD | 4 to 6 | 60 to 90 | Expiration dating meets broad assortments and repeat buyers |
| Hardware and home improvement | 3 to 5 | 70 to 120 | Long-tail SKUs stocked for service, not speed |
| Sporting goods | 3 to 5 | 70 to 120 | Seasonal peaks plus wide size and model ranges |
| Gift, hobby, and thrift | 2 to 4 | 90 to 180 | Discovery-led buying and one-off or consigned goods |
| Furniture and home furnishings | 2 to 4 | 90 to 180 | Considered purchases with long decision cycles |
A note on the convenience row: figures published for gas and convenience often reach 24x to 37x, but those blend in fuel, which turns over many times faster than anything on the shelf. Inside merchandise, the stock you actually purchase and price, moves far slower. Judge your own performance on the in-store reading.
Public filings anchor the faster end of the table. For their most recent fiscal years, Costco turned inventory 13.2 times, Walmart 9.1 times, Home Depot 4.5 times, and Lowe’s 3.3 times, all calculated as cost of sales divided by average inventory.
Home Depot publishes its own turnover figure in its quarterly filings, which is a rare chance to check a benchmark against the retailer’s own math. Category data from Retalon places liquor stores near 6.1x and supplements near 4.9x.
Treat each range as a starting hypothesis, not a verdict. Assortment breadth, store format, and supplier lead times all shift the target.
What Causes a Low Inventory Turnover Ratio
A low ratio means stock is sitting longer than your category norm, and the cause is rarely just one thing. Storage costs climb, whether the goods occupy shelf space or a warehouse rack, and capital stays frozen.
Common culprits:
- Overbuying. Case minimums and vendor deals push order sizes past what demand supports.
- Prices set too high. Items priced above the local market move slowly regardless of assortment quality.
- Weak promotion or poor placement. Products nobody sees do not sell.
- Staff performance gaps. Suggestive selling and product knowledge shift velocity on discretionary categories.
- Dead stock inflating the denominator. Unsellable goods still carried at cost drag the ratio down with no change in sales. Dead stock needs to leave the building, not just the report.
- Stale counts. Inventory the system thinks you own but you do not distorts the average.
Risks of a High Inventory Turnover Ratio
A very high ratio can signal underordering. Turns well above your category range usually carry costs the metric alone will not surface.
- Lost sales. Every stockout sends a customer to a competitor, and repeat gaps on popular items erode loyalty. Our guide to avoiding stockouts covers the buffer math.
- Higher freight per unit. Frequent small orders forfeit volume breaks and multiply delivery charges.
- Shrinking assortment. Turnover improves automatically when you cut SKUs, so a rising ratio alongside flat revenue may mean you traded selection for a prettier score.
- No cushion for demand spikes. Lean stores get punished hardest by a supplier delay or an unexpected weekend rush.
How To Analyze Inventory Turnover by Category and SKU
Store-wide turnover is a health check, not a purchasing tool. A blended figure of 6 can hide a beverage category turning 14 times and a glass case turning 1.5 times, and nobody writes a purchase order off a store-wide blend.
Calculate Turnover by Department
Calculate turns for each department or category you buy separately. A smoke shop typically lists disposables and e-liquid at the top, coils and batteries in the middle, and water pipes at the bottom. The spread tells you where to move open-to-buy dollars.
Rank Your Categories With ABC Analysis
Sort each category by revenue contribution and calculate turns within each tier. ABC analysis supplies the framework: A items deserve tight reorder discipline and frequent counting, while C items are usually where slow turns hide.
Keep Units Consistent for Case Break Inventory
Retailers who break bulk need consistent units before any of the math means something. Case break inventory logged in cases on the receiving side and singles on the sales side produces turnover figures that look wrong in both directions.
Inventory Turnover vs. GMROI: Why Fast Turns Do Not Equal Profit
Two products can turn at identical rates while one earns twice the gross margin per inventory dollar. Turnover measures velocity, not return, so pair it with a profitability metric before acting on it.
GMROI = Gross Margin Dollars ÷ Average Inventory Cost
Gross margin return on investment of 2 means you earn $2.00 in gross margin for every $1.00 tied up in stock. Anything above 1.0 indicates the inventory pays for itself, and most retailers treat 2 to 3 as healthy, though the target moves by category.
The pairing changes decisions. A slow-moving premium spirit at a 40% margin may out-earn a fast-moving value brand at 12%, and delisting it to improve your turnover ratio would cost you money. Run GMROI beside turns on any category before you cut it, and check sell-through rate on seasonal buys where the real question is what percentage of one specific order moved.
Why Your Inventory Turnover Calculation May Be Wrong
Your turnover ratio is only as reliable as the average inventory value underneath it. Five problems corrupt that denominator quietly, and each produces a result that looks perfectly plausible.
- Uncounted shrink. Theft, breakage, and expired goods leave the shelf without leaving the system, so recorded inventory overstates reality and turnover reads low.
- Receiving errors. Shipments logged at the wrong quantity, or never logged, shift the denominator in either direction.
- Phantom or negative stock counts. Items showing impossible quantities signal broken records that need reconciliation before any ratio is worth reading.
- Mixed valuation bases. Inventory valued at retail in one report and at cost in another guarantees a meaningless answer.
- Excise tax and deposit distortions. Categories where tax or bottle deposits sit inside recorded cost need identical treatment in the numerator and the denominator.
Cycle counting solves most of it. Spread counts across the year so every item gets verified at least once, prioritize A items and anything with a discrepancy history, and reconcile before pulling a quarterly report. Useful inventory reporting starts with counts you actually believe.
How To Improve Your Retail Inventory Turnover
Improving your inventory turnover means matching a specific fix to the specific cause behind your number. Work the diagnosis in order before you reach for tactics.
Measure Your Total Store Turnover First
Get a baseline for the whole store first, particularly if you have never calculated one. Most accounting software and any capable POS report will produce it, and one year of history gives you a trend line.
Break Turnover Down by Category and Item
Move to category and item-level turns once the baseline exists, since the detail identifies your most and least productive products precisely. Pull the bottom decile by turns, then cross-check each item against its margin before deciding what to cut.
Compare Turnover Across Seasons
Analyze sales across specific periods to surface the ebbs and flows most retailers sense but have never quantified. Calculate turnover for each season separately, find ways to move slow-moving inventory during quiet stretches, and confirm you carry enough depth going into peaks.
Which Fix Solves Which Turnover Problem
Each low-turnover cause has a different remedy, and the wrong one wastes cash:
- Overbuying calls for tighter reorder points and par levels built from actual lead times, not vendor minimums.
- Overpricing calls for a market check on your top 50 items before any markdown decision.
- Dead stock calls for clearance, vendor return, or bundling, followed by removal from the count.
- Supplier variability calls for a second source. Using POS data to evaluate suppliers exposes which vendors are actually forcing your buffer requirements.
- Assortment bloat calls for SKU rationalization, so open-to-buy dollars concentrate on proven sellers.
Test Pricing and Promotions Against Turnover
Measure turns for a few months before and after a campaign to isolate its effect. A/B test prices and promotions across comparable periods, compare stock turnover for each, and marketing spend becomes a measurable input in place of a guess. Additional inventory control methods give you more levers to test.
How a POS System Tracks Inventory Turnover
A POS system calculates turnover automatically because it already holds both halves of the formula. Sales and receiving data produce COGS, perpetual stock records produce average inventory, and the ratio updates without a spreadsheet.
Capabilities worth confirming before you commit to a platform:
- Turns reporting by category, supplier, and item, not only a store-level total.
- Reorder levels recalculated from purchase history, season, and trend, not fixed minimums set once and forgotten.
- Cycle count tools that let you verify sections of the store on a rotating schedule.
- Multi-location comparison, so a slow department in one store shows up beside its twin elsewhere.
- Consistent valuation across all reports, with cost and retail values kept distinct.
KORONA POS covers each of these and stays processor-agnostic, so you keep your current payment relationship or shop for a better rate without replacing your software. Our retail POS system consolidates stock into one database, whether you run one store or forty, and cloud access means you can pull a turns report from anywhere.
The inventory management module breaks metrics into data points you can act on, and better inventory planning follows from there.
Get Your Inventory Turnover Under Control With KORONA POS
Your turnover ratio earns its keep only when you can pull it by category, trust the counts behind it, and act before the season closes. The right POS makes all three routine.
Check out KORONA POS for a powerful retail solution. Set up a free trial and demo with one of our product specialists, and we’ll walk you through the features that fit your business.
Speak with a product specialist and learn how KORONA POS can power your business.
Frequently Asked Questions
What Is a Good Inventory Turnover Ratio for a Retail Store?
It depends on your category. Convenience stores often run 10 to 15 turns on in-store merchandise, liquor stores target 6 to 8, and gift or furniture retailers can be healthy at 2 to 4. Pick the benchmark that matches what you sell.
Should I Use COGS or Sales To Calculate Inventory Turnover?
Use cost of goods sold. A sales numerator compares revenue with stock valued at cost, so the result climbs by your markup and stops matching published benchmarks. Cost data top and bottom keeps the comparison honest and your trend reliable.
How Often Should Retailers Calculate Inventory Turnover?
Quarterly for store-level tracking, monthly for fast-moving categories. Annual snapshots bury the seasonal swings that shape purchasing. Whatever cadence you choose, hold it steady, since two windows of unequal length cannot be compared to each other.
What Does an Inventory Turnover Ratio of 2 Mean?
Your stock sold and was replaced twice, leaving about six months of merchandise on hand. In most categories that points to overstocking or soft demand. Furniture, gift, and thrift stores can still run profitably at that pace.
Can Inventory Turnover Be Too High?
Yes. Turns well past your category norm usually point to thin ordering, which costs you sales when shelves empty and adds freight on small, frequent deliveries. Flat revenue beside a climbing ratio often means the assortment got smaller.
How Is Inventory Turnover Different From Sell-Through Rate?
Turnover counts how many times your whole stock position cycles over a period. Sell-through tracks a single delivery, showing how much of that shipment cleared before your deadline. Reach for turnover on repeat categories and sell-through on seasonal or trial buys.