This guide covers the KPIs that matter most to dispensaries, how to track them properly, and the tools dispensary owners use to stay on top of their numbers. In a market as regulated as cannabis retail, gut instinct is not enough. Read on to learn more.
Key Takeaways:
- Your POS system is your most valuable KPI tool. Use its analytics, dashboards, and inventory reports consistently rather than occasionally.
- Cannabis businesses need a secondary processor, and POS systems like Square or Shopify are not built for that reality.
- Tracking KPIs only matters if each review ends with a clear action — data without a decision is just noise.
What Are Cannabis Dispensary KPIs? (and Why They Matter)
Cannabis dispensary KPIs are measurable numbers that tell you how well your store is performing. They cover areas like sales, inventory, customer behavior, and staff output. Instead of guessing why revenue is up or down, KPIs give you a specific answer. For dispensary owners, they are especially important because margins are tight, regulations are strict, and the cost of a bad inventory or staffing decision adds up fast.
Top 13 KPIs Every Cannabis Dispensary Should Track
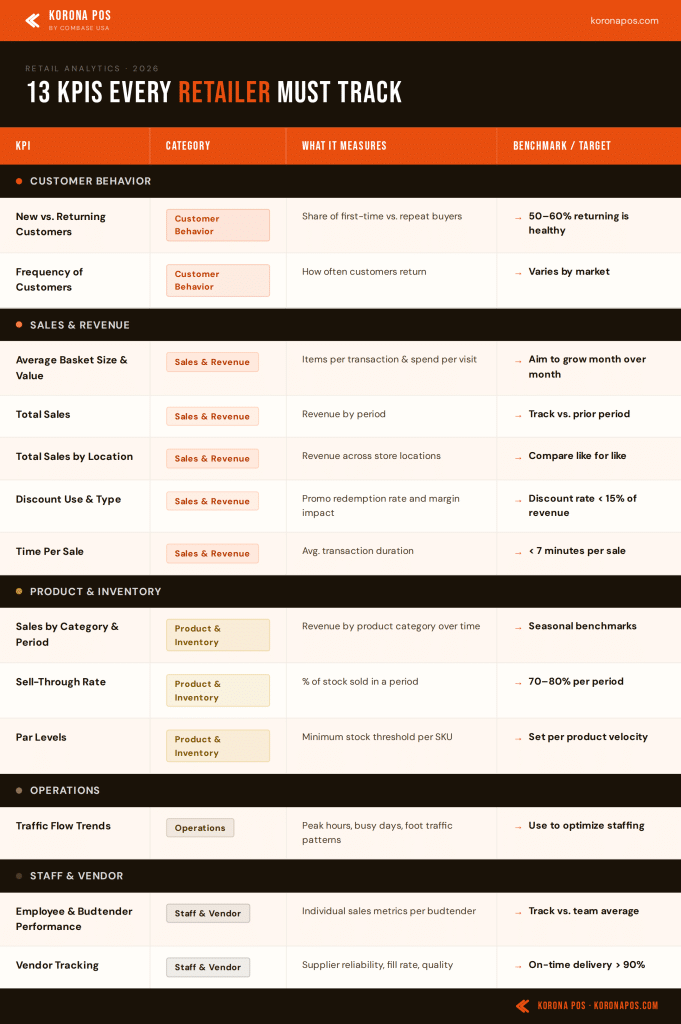
Running a dispensary without tracking KPIs is like driving without a dashboard. The metrics below cover every core area of your business. Each one tells you something specific, and together they give you a clear picture of how your dispensary is performing week to week.
Use the table below as a quick reference, then read each section for the full breakdown:
Customer Behavior KPIs
New vs. Returning Customers
- What it measures: The ratio of first-time visitors to repeat customers in any given period.
- Why it matters: A healthy dispensary needs both. New customers signal that your marketing and reputation are working. Returning customers signal that your product selection, staff, and experience are worth coming back for. If new customer numbers are high but returning numbers are low, something is breaking after the first visit.
- How to track it: Use your POS customer database. Tag first-time buyers and compare that count to returning buyers each week or month.
- Example: If 70% of your monthly transactions come from new customers but retention after the first visit is only 20%, focus on loyalty incentives and follow-up outreach before spending more on acquisition.
Frequency of Customers
- What it measures: How often individual customers return to your dispensary over a set time period: weekly, monthly, or quarterly.
- Why it matters: Repeat customers spend more, cost less to retain, and are more likely to refer others. If most customers visit once and do not come back, something in the experience needs attention.
- How to track it: Use your CRM or loyalty data inside your POS system. Segment customers by visit frequency to identify your most loyal buyers and those who have gone quiet.
- Example: A customer visiting once per month and spending $80 each visit generates more annual revenue than a weekly visitor spending $15. Visit frequency combined with basket value tells the full story.
PRO TIP!
KORONA POS integrates directly with springbig, a leading cannabis loyalty platform. Use it to send automated SMS reminders to customers who have not visited in 30 or more days.
Sales & Revenue KPIs
Average Basket Size and Value
- What it measures: The average number of items per transaction (basket size) and the average dollar amount spent per transaction (basket value).
- Why it matters: Getting a customer through the door costs money. Maximizing what they buy each visit directly improves revenue without increasing customer acquisition costs.
- How to track it: Divide total revenue by total number of transactions for any given period. Track basket size separately by dividing total units sold by total transactions.
- Example: If your average basket value sits at $45 but competitors in your area average $62, your budtenders may benefit from more upsell training, or your product layout may need rethinking.
PRO TIP!
Use KORONA POS customer analytics to identify which products are frequently bought together. Build bundled promotions around those pairings to naturally raise basket size.
Total Sales
- What it measures: Total revenue generated across all transactions within a defined time period: daily, weekly, monthly, or annually.
- Why it matters: Total sales is your most fundamental performance number. Without a reliable baseline, it is impossible to know whether changes you make are helping or hurting the business.
- How to track it: Pull total sales reports from your POS system. Compare period over period: this week vs. last week, this month vs. last month, and year over year.
- Example: If total sales drop 15% in February compared to January, check whether the cause is seasonal (shorter month, post-holiday slowdown) or operational (staffing gaps, stock shortages).
Total Sales by Location
- What it measures: Revenue generated by each individual store location over a given period.
- Why it matters: For multi-location dispensaries, comparing store-level performance shows which locations are thriving and which need attention. Without location-level data, a weak store can hide behind a strong one in your overall numbers.
- How to track it: Access location-level sales reports in your POS. Compare revenue, transaction count, and average basket value across all stores side-by-side.
- Example: If your downtown location generates $80,000 per month while your suburban store generates $30,000 with similar foot traffic, the gap may point to differences in staffing, product mix, or local pricing.
PRO TIP!
KORONA POS lets you monitor all store locations from a single dashboard. Group stores by city or region to benchmark performance and make tailored inventory decisions for each market.
Discount Use & Type
- What it measures: The percentage of transactions that include a discount or promotional code, broken down by discount type (loyalty reward, SMS offer, seasonal promo) and the margin impact of each.
- Why it matters: Promotions that do not generate measurable lift just cut into your margins. Tracking discount use tells you which offers are attracting customers and which are simply giving away revenue.
- How to track it: Assign unique promo codes to each campaign (SMS, Weedmaps listing, Instagram). Track redemption rates and compare sales volumes during promo periods against your baseline.
- Example: If a “20% off flower Friday” promo increases Friday transactions by 35%, the campaign is earning its cost. If it moves only 5% more transactions, the margin loss likely is not worth it.
Time Per Sale
- What it measures: The average total time from when a customer checks in to when they complete their purchase at the register.
- Why it matters: Long wait times push customers out the door and keep them from coming back. A low average transaction time signals smooth checkout flow and a well-trained team.
- How to track it: Pull transaction timestamps from your POS system. Calculate the average gap between check-in and sale completion across all daily transactions.
- Example: If your average time per sale is 12 minutes on Saturday afternoons but only 5 minutes on Tuesday mornings, your POS data will show you exactly where to add staff.
PRO TIP!
KORONA POS logs transaction times automatically. Use the built-in reporting tools to identify your slowest periods, then schedule extra budtenders accordingly.
Product & Inventory KPIs
Cannabis Product Sales by Category and Time Period
- What it measures: Revenue and unit volume broken down by product category (flower, edibles, concentrates, topicals, pre-rolls) and filtered by time period: week, month, or season.
- Why it matters: Not every category performs the same year-round. Knowing which categories drive revenue during specific periods helps you order smarter and avoid dead stock.
- How to track it: Use POS category-level reports. Filter by month or season and compare year-over-year to identify true patterns versus one-time spikes.
- Example: Cannabis-infused beverages often spike in summer. Edibles around the holidays tend to outsell other categories. Use at least 12 months of data to separate seasonal patterns from anomalies.
Sell-Through Rate
- What it measures: The percentage of received inventory sold within a specific time period. Formula: Units Sold ÷ Units Received × 100.
- Why it matters: Cannabis products are perishable. A low sell-through rate means products sit on shelves past their prime, tying up cash and occupying space that could be filled by better-performing products. Most dispensaries aim for 70-80%.
- How to track it: Pull inventory receipts and sales data by SKU from your POS. Calculate sell-through for each product over the same time window.
- Example: If you receive 1,000 units of a strawberry gummy and sell 700 in a month, your sell-through is 70%. A product that consistently lands below 50% is a candidate for a clearance discount or discontinuation.
PRO TIP!
KORONA POS automatically tracks sell-through by product and category. Set low-threshold alerts to flag underperforming SKUs before they become dead stock.
Par Levels
- What it measures: The minimum stock quantity for each SKU that triggers a reorder. Par levels define the floor below which you should never let inventory fall.
- Why it matters: Running out of popular products costs you sales and frustrates customers. Par levels act as an early warning system, so reorders happen before a stockout occurs rather than after.
- How to track it: Set par levels for each product based on average daily sales and your supplier’s lead time. Most POS systems can automatically flag items that fall below par.
- Example: If a pre-roll sells 30 units per day and your supplier takes 4 days to deliver, your par level should be at least 120 units. When stock drops to that number, it is time to reorder.
PRO TIP!
KORONA POS supports par-level tracking and reorder alerts by product. Set your thresholds once and let the system notify you when it is time to restock, so nothing runs out unexpectedly.
Operations KPIs
Traffic Flow Trends
- What it measures: The volume of customer visits over time, including peak hours, slow periods, and day-of-week patterns.
- Why it matters: Staffing the wrong number of budtenders at the wrong times is expensive either way: too many during slow hours wastes labor cost, too few during busy hours means long waits and lost sales.
- How to track it: Use your POS system’s traffic and transaction volume reporting. Look at hourly transaction counts across each day of the week to find your true peak and off-peak windows.
- Example: If your store is consistently slow on Monday midday, a targeted happy hour promotion for that slot can bring in extra foot traffic without affecting your busiest periods.
Staff & Vendor KPIs
Employee and Budtender Performance
- What it measures: Individual sales metrics per employee: average basket value, units per transaction, and transaction count per shift.
- Why it matters: Budtenders are your frontline sales team. Knowing who is performing well and who needs coaching helps you deploy your strongest staff during peak hours and build a training program based on real data.
- How to track it: Filter POS sales data by employee. Compare average basket value, upsell rate, and transaction volume per team member across similar shifts and time periods.
- Example: If budtender A averages a $65 basket value while budtender B averages $40 across the same shifts, the gap may point to differences in product knowledge, confidence, or customer engagement style.
Vendor Tracking
- What it measures: Supplier reliability metrics: on-time delivery rate, fill rate (what percentage of ordered quantity actually arrives), product quality consistency, and return or short-shipment frequency.
- Why it matters: A great product paired with an unreliable supplier is a liability. Vendors who frequently deliver late, ship short quantities, or send inconsistent quality create stockouts, compliance friction, and customer disappointment.
- How to track it: Log each purchase order alongside the actual delivery date and quantities received. Compare ordered versus received quantities by vendor over a rolling 90-day window.
- Example: If a vendor has a 60% on-time delivery rate over three months, it is worth evaluating whether a more reliable alternative exists, even if the product sells well.
Performance Tracking for Cannabis Dispensaries
Knowing your KPIs is only half the job. The other half is having a reliable system for consistently tracking them. Here is how to do it without overcomplicating the process.
1. Use Your POS Analytics as Your Primary Data Source
Your POS system already captures sales, inventory, and customer data on every transaction. Most of what you need, basket value, sell-through rate, transaction volume, is already there. Dispensary owners who want a cleaner picture of what their store actually earns after costs will find POS-level reporting indispensable for separating gross revenue from real take-home numbers.
2. Build a KPI Dashboard You Check Every Week
A single KPI dashboard that consolidates your key retail metrics into a single view makes it far easier to spot trends and catch problems early. Set it up once, pin your five to seven most important metrics, and review it at the start of each week. KORONA POS makes this straightforward with its built-in reporting and analytics view, which surfaces the numbers that matter without requiring manual exports.
Discover Advanced Analytics and Custom Reports
Speak with a product specialist and learn how KORONA POS can work for your business.
3. Monitor Inventory KPIs on a Set Schedule
Inventory data goes stale fast in cannabis retail. Check sell-through rates and par levels at least twice a week. A weekly audit catches slow-moving SKUs before they expire and flags reorder needs before you run out of top sellers. Waiting until the month-end to review inventory numbers is too late.
4. Connect Your eCommerce Platform to Your POS
If you sell online and in-store but track them separately, your KPIs will always tell an incomplete story. Integrate your eCommerce platform with your POS so that online orders, in-store pickups, and walk-in transactions all feed into the same reporting view. KORONA POS supports eCommerce integrations that keep your data unified across channels, so you never work with partial numbers.
5. Run Monthly KPI Reviews With Your Team
Weekly dashboards catch issues. Monthly reviews are where you act on them. Set aside 30 minutes each month to go through your key metrics with your managers, identify what improved, what did not, and what changes to make. Keep it focused on two or three priorities at a time rather than reviewing every number at once.
Tools & Software That Improve Cannabis Performance Tracking
The right software automates KPI tracking rather than leaving it manual. Knowing which retail metrics actually move the needle will help you choose a platform that surfaces the right data at the right time. Here are five POS systems worth considering for your dispensary.
1. KORONA POS
KORONA POS is built for dispensaries that need strong analytics without the complexity. It offers customizable dashboards, automated inventory reports, and eCommerce integration in one platform. It’s ideal for multi-location retail businesses. For operators focused on managing their store more efficiently, KORONA POS keeps everything visible without switching between tools.
2. Flowhub
Flowhub is a cannabis-native POS with deep integrations to METRC and BioTrack. It includes mobile tools for budtenders, door check-in with ID scanning, and analytics dashboards accessible on the go. A solid option for dispensaries where floor speed and compliance accuracy are top priorities.
3. Dutchie POS
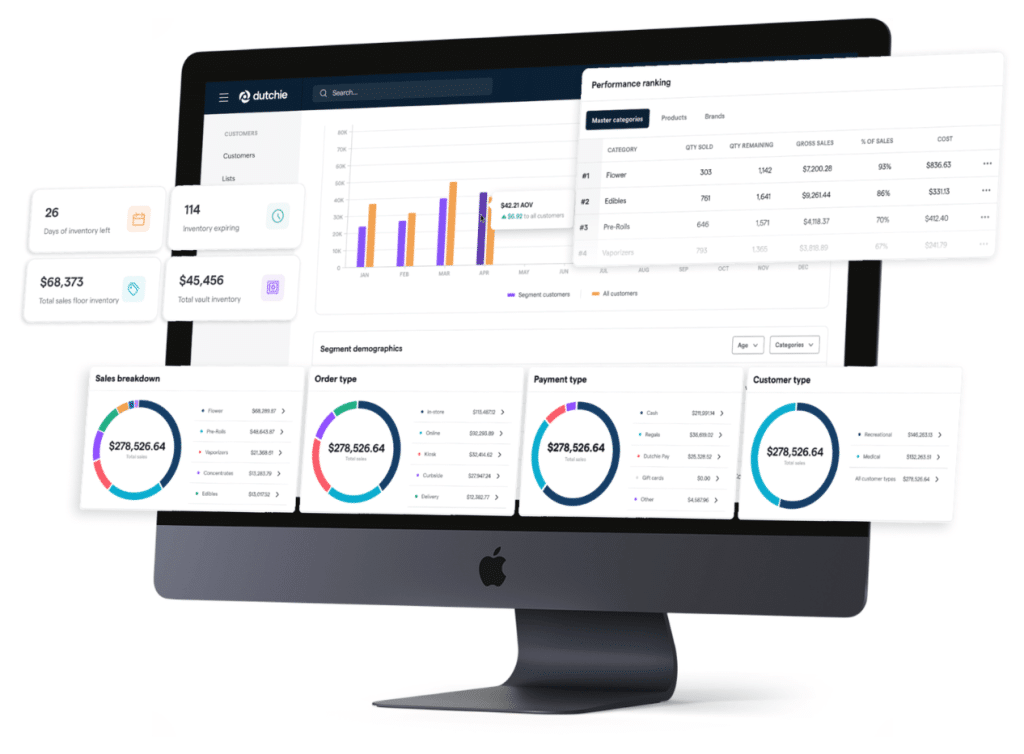
Dutchie combines in-store POS with a built-in e-commerce menu that automatically syncs inventory across channels. Promotions set in-store reflect online without extra steps. Getting retail inventory management right across both channels is one of Dutchie’s clearer strengths.
4. BLAZE Retail
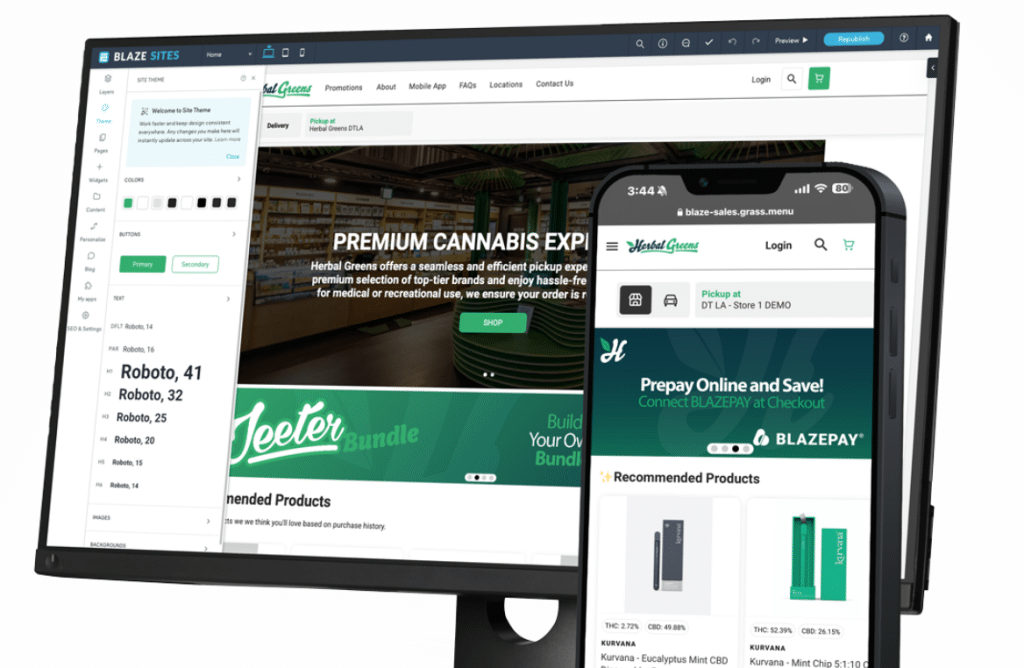
BLAZE is an AI-powered cannabis retail platform covering POS, inventory, loyalty, and native e-commerce in one system. It auto-syncs inventory adjustments and compliance data, and its loyalty module is particularly well-suited for dispensaries focused on repeat customer metrics.
5. Treez
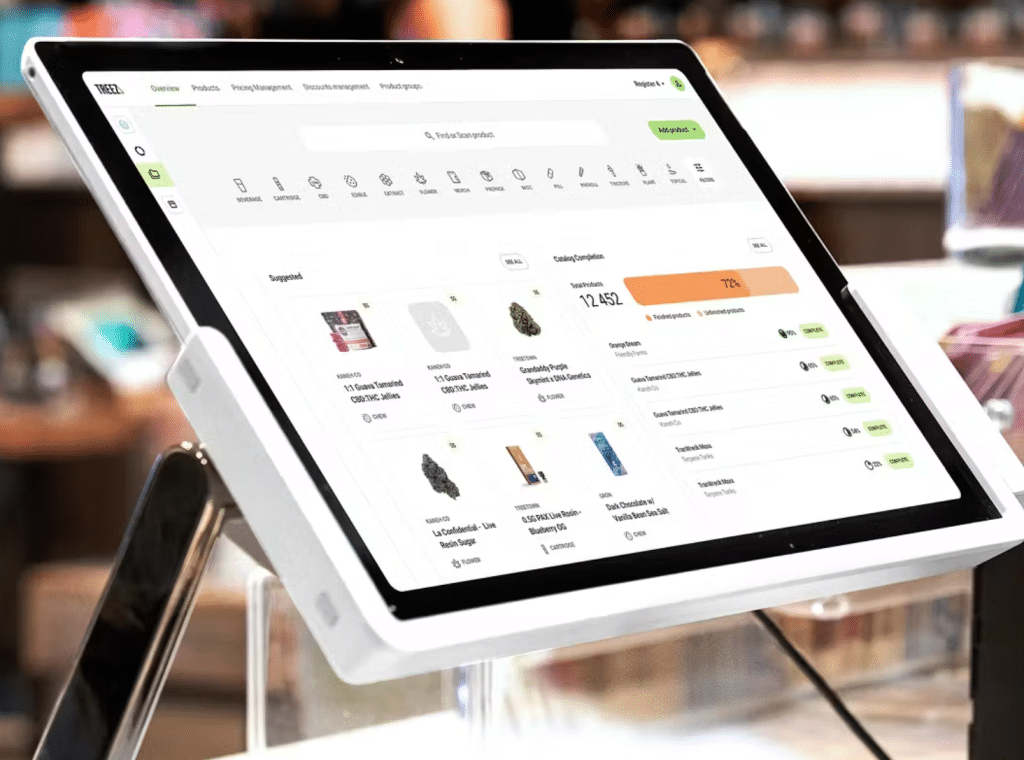
Treez is an enterprise-grade cannabis retail management system built for larger or multi-location dispensaries. It handles POS, online ordering, delivery, and loyalty programs from a single back end, with automated METRC compliance reporting built into every transaction.
Common Mistakes Dispensaries Make with KPIs
Tracking KPIs is only useful if you are doing it right. Many dispensaries collect data but still make avoidable errors that limit what that data can actually tell them. Whether you are opening a new dispensary or running an established one, these are the mistakes most likely to get in your way.
- Tracking too many metrics at once. When everything is a priority, nothing is. Pick five to seven KPIs that directly reflect your business goals and focus there first.
- No consistency in how or when data is pulled. Comparing last Monday’s numbers to last month’s total is not useful. Set a fixed cadence and stick to it.
- Skipping employee accountability. KPIs like basket value and time per sale are tied directly to staff behavior. If budtenders never see their own numbers, nothing changes.
- Poor inventory tracking habits. Inconsistent stock counts lead to inaccurate sell-through data and missed reorder windows. The most common inventory management challenges in retail almost always trace back to irregular auditing.
- Collecting data but taking no action. A report that nobody reads or acts on is just noise. Each review session should end with at least one concrete decision.
KORONA POS Offers The Best Built-In KPIs For Cannabis Stores
KORONA POS gives dispensary owners built-in KPIs for sales performance, inventory turnover, employee productivity, basket size, and traffic flow, all from a single dashboard. It scales across multiple locations with no added complexity, and unlike Square, Shopify, or Lightspeed, it is fully processing agnostic and supports dual pricing, a critical feature for cannabis retailers managing cash and cashless transactions.
General-purpose POS systems like Square can put cannabis businesses at serious risk. Cannabis is classified as high-risk, meaning you need a secondary processor. KORONA POS is built with that in mind from day one.
Ready to see it in action? Call us at (833) 200-0213, book a demo with one of our product specialists, or start your unlimited free trial today — no credit card required.