
An inventory control report gives retail businesses a clear view of what they have in stock, its value, and the gaps. Without one, purchasing decisions are guesswork, and losses go unnoticed until they show up on a financial statement.
In the sections below, we cover the types of inventory control reports every retailer needs, the KPIs worth tracking, and how to use report data for seasonal planning and supplier negotiations. We’ll also discuss what best practices actually look like in day-to-day operations.
Key Takeaways:
- A spreadsheet gets you started, but inventory management software is what keeps your stock data accurate, your reports automated, and your purchasing decisions grounded in numbers.
- Retailers who use these reports well do not just track inventory; they use the data to buy smarter, catch shrinkage early, and negotiate from a position of strength.
- A simple report pulled on a consistent schedule will always outperform a detailed one that nobody runs.
What Is an Inventory Control Report?
An inventory control report is a structured document that captures the state of your stock at a specific point in time. It records how much of each product you have, where it is located, what it is worth, and whether the numbers match what your system says they should.
Inventory Control Report vs. Inventory Management Report
An inventory control report is a snapshot. It tells you where your stock stands right now. An inventory management report is longitudinal.
It tracks KPIs like turnover ratios, reorder performance, and gross margin return over weeks, months, or quarters.
Control reports answer “what do we have?” Management reports answer “how well are we managing it?” Both matter, but confusing one for the other creates gaps in your data strategy.
Inventory Report vs. Inventory Audit
An inventory report is generated regularly, often automatically by your POS or management software. An inventory audit is a formal verification process that compares your report data against a physical count of actual stock.
Audits are typically scheduled quarterly or annually and are used to confirm accuracy, catch losses, and satisfy accounting requirements. Reports keep the business running day to day. Audits validate that the data in those reports can be trusted.
Physical vs. Digital Reports
Small retailers with a limited number of SKUs can manage inventory control with a well-maintained spreadsheet. It works as a starting point, but it relies on manual input, which introduces human error.
Digital reports are generated automatically by a POS update as sales and deliveries occur throughout the day.
As your product range grows, the case for digital reporting becomes stronger. The right POS hardware — including barcode scanners and receipt printers — ensures every transaction is logged accurately from the start. The more SKUs you manage, the less forgiving manual tracking becomes.

Why Inventory Control Reports Are Critical for Retail?
Poor stock visibility costs more than most owners realize. Here is why inventory control reports need to be part of your regular operations.
- They prevent stockouts and overstock. You either lose the sale when shelves run empty or lose money when stock piles up unsold.
- They improve purchasing decisions. You order with more confidence when you know exactly what is moving and what is not.
- They catch shrinkage early. They flag gaps in your stock counts before small losses turn into bigger problems.
- They protect your financial records. Your balance sheet and income statement both depend on accurate inventory figures to stay reliable.
- They keep customers happy. Your customers expect the products they want to be on the shelf when they walk in.
10 Essential Types of Inventory Control Reports for Retail
Not all inventory reports serve the same purpose. Here are the ten you need to know as a retail business owner.
1. Inventory On-Hand Report
The on-hand report shows how many units of each product you have in stock at any given moment, across all locations. It is the starting point for almost every inventory decision you make.
2. Low-Stock and Stockout Report
The low-stock report alerts you when a product drops below a set threshold, giving you time to reorder before shelves run empty. Without it, you find out a product is gone only after a customer tells you.
3. Inventory Valuation Report
The inventory valuation report calculates the total monetary worth of your current stock. It shows how much capital is tied up in inventory at any given time.
4. Inventory Turnover Report
The turnover report tracks how many times your stock is sold and replaced within a set period. A low inventory turnover rate is a signal that certain products are sitting too long.
5. Inventory Aging and Slow-Movers Report
The aging report identifies products that have been sitting in your store for too long and are not selling. The earlier you spot slow-movers, the more options you have to clear them before they become dead stock.
6. COGS Report
The COGS report shows the direct cost of every product sold within a given accounting period. It is essential for calculating gross profit and understanding the true margin behind your sales.
7. Purchase Order Report
The purchase order report gives you a complete view of open orders, expected delivery dates, and supplier lead times. It helps you plan ahead and avoid the gaps that lead to stockouts.
8. ABC Analysis Report
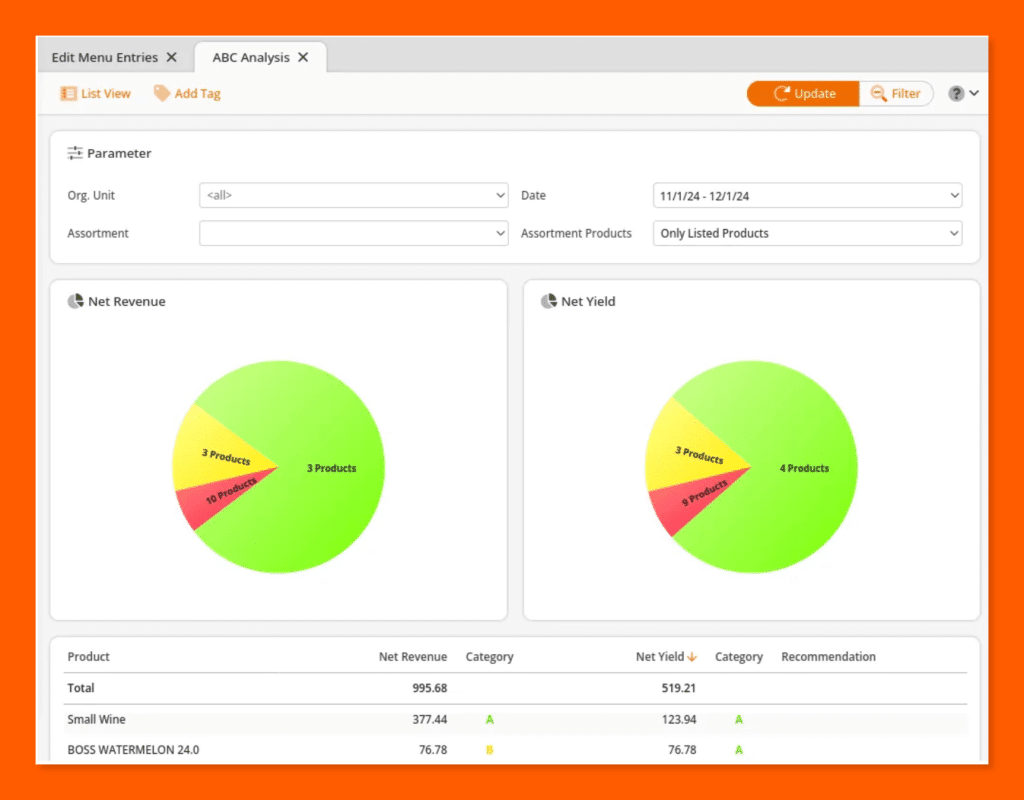
The ABC analysis report groups your products into three categories based on their value and sales volume. A-items drive the most revenue, B-items are moderate contributors, and C-items are low-value or slow-moving SKUs.
9. Sell-Through Rate Report
The sell-through rate report measures what percentage of received inventory you sold within a specific period. A high rate signals strong demand; a low rate points to overbuying or weak product performance.
10. Inventory Shrinkage and Variance Report
The shrinkage report compares your expected stock levels against what is physically on hand and flags any unaccounted differences. It is one of the most important tools for identifying theft, damage, or data entry errors before they compound.
Key KPIs Every Retail Inventory Control Report Should Track
Tracking the right numbers is what separates a useful report from one that just fills a spreadsheet. Here are the five retail KPIs your inventory control reports should always include.
Inventory Turnover Ratio
The inventory turnover ratio tells you how many times you have sold and replaced your stock within a given period. A healthy benchmark varies by retail category, but a higher ratio generally means your capital is working harder.
Gross Margin Return on Investment (GMROI)
GMROI measures how much gross profit you earn for every dollar you invest in inventory. It is one of the clearest indicators of whether your buying decisions are actually generating returns.
Days of Supply (DOS)
Days of supply tells you how long your current stock will last at your current rate of sales. It helps you time reorders accurately and avoid both emergency purchases and excess holding costs.
Sell-Through Rate
The sell-through rate shows what percentage of a product you received from a supplier was actually sold within a set period. Consistently low rates across a category point to a buying or pricing problem worth addressing.
Stockout Rate and Fill Rate
The stockout rate tracks how often a product is unavailable when a customer wants it, while the fill rate measures how completely you met demand across all orders. Tracking both together gives you a fuller picture of your inventory performance.
Inventory management a headache?
KORONA POS makes stock control easy. Automate tasks, generate custom reports, and learn how you can start improving your business.
What to Include in a Retail Inventory Control Report
A good inventory control report is only as useful as the fields it contains. Here is what every retail report should include, broken down by category.
Core Fields
Core fields form the foundation of any inventory report and should include the report date, product name, SKU or barcode, location, and units on hand. You also need columns for available stock, committed units (sold but not yet fulfilled), and incoming inventory currently in transit.
Financial Fields
Financial fields tell you what your inventory is worth and what it costs to sell. At a minimum, include unit cost, total inventory value, and a COGS column updated at the end of each accounting period.
Movement Fields
Movement fields track what happened to your stock over a given period. Record units sold, units received, and any variance or shrinkage to give yourself a clear picture of how inventory flowed in and out.
Reorder Fields
Reorder fields are the columns most retail templates leave out, yet they are what make a report actionable. Include a reorder point, a reorder quantity, and the supplier lead time for each SKU so you know exactly when and how much to order.
Template Walk-Through
A simple spreadsheet in Excel or Google Sheets can cover all of the above if you are starting out with a small product range. As your SKU count grows, a POS or inventory management system will handle these fields automatically and keep them updated as transactions happen.
How to Use Inventory Control Reports for Seasonal Planning and Demand Forecasting?
Most retailers think about inventory reports in the present tense. Used well, they are just as powerful for planning what comes next.
Using Historical Sell-Through Data to Plan Your Budget
Your historical sell-through data tells you exactly how much of each product sold in a given season, which makes it the most reliable input for building your open-to-buy budget. Instead of guessing how much to order next quarter, you work from numbers that already reflect what your customers actually bought.
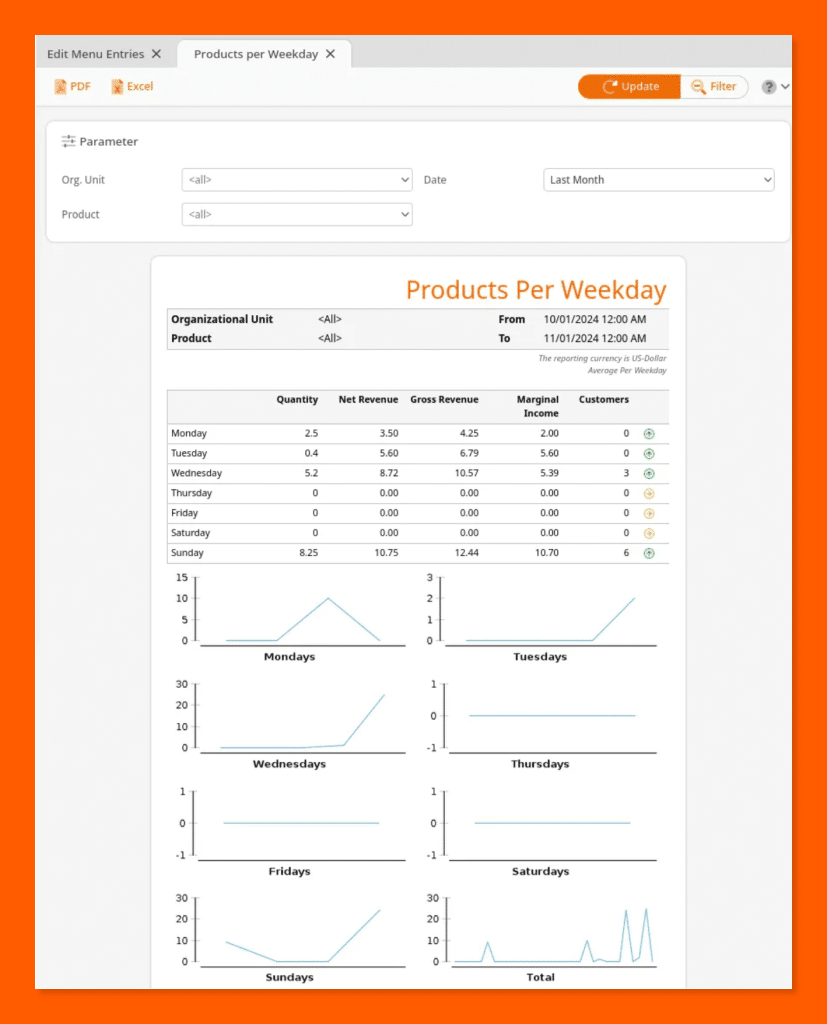
Identifying Seasonal Trends in Your Reports
Your aging and turnover reports hold seasonal patterns that repeat year after year if you know where to look. A product that slows down every February or spikes every October is telling you something your next purchase order should reflect.
Combining Inventory Data with External Signals
Inventory data alone does not account for everything that drives demand in your store. Pairing your reports with external factors like local events, promotions, or seasonal weather gives you a more accurate picture of what to stock and when.
Acting on Aging Stock Before Margin Erodes
When your aging report flags a slow-mover, the window to act is shorter than most retailers expect. A well-timed markdown or a bundled promotion can recover margin on aging stock before it becomes a write-off.
Inventory Control Reports for Multi-Location and Omnichannel Retailers
Running inventory across multiple locations adds a layer of complexity that a single-store report cannot address. Here is how to approach multi-store inventory management when your business spans multiple channels or sites.
The Challenge of Syncing Stock Across Channels
When you sell in-store, online, and through a warehouse simultaneously, keeping stock counts accurate across all three is one of the hardest problems in retail operations. A sale on your website needs to immediately reduce the same unit count your store manager sees on their screen.
Consolidated vs. Location-Level Reporting
A consolidated report gives you a single view of total stock across all your locations. A location-level report breaks that data down by site, so you can spot where stock is running low or sitting idle at a specific location.
Inter-Location Transfers
When one location is overstocked and another is running low, a transfer is often faster and cheaper than placing a new purchase order. Your inventory reports are what make those imbalances visible early enough to act on them.
Inventory Location Report
The inventory location report shows how many units of each product you hold at every storefront, warehouse, or third-party logistics provider. It is the report that makes redistribution decisions possible without having to call each location for a manual count.
How to Use Inventory Reports to Negotiate Better with Suppliers?
Most retailers walk into supplier meetings with little more than a gut feeling about what they need. Your inventory reports change that conversation entirely.
Using Sell-Through Data to Justify Order Volumes
Your sell-through rate gives you hard evidence for why you need more of a product or why you plan to order less. Suppliers respond differently when you bring data rather than opinions.
Using Turnover Benchmarks to Negotiate Pricing
When a product turns over quickly and consistently, you have a strong case for pushing your supplier on pricing or minimum order quantities. High turnover means reliable volume for them, and that is a card worth playing.
Identifying Underperforming Suppliers Through Lead Time Analysis
Your purchase order report tracks how consistently each supplier delivers on time and in full. Patterns of late or short deliveries are visible in the data long before they cause a stockout, and that information belongs in every supplier review.
Building a Supplier Scorecard
A supplier scorecard pulls together purchase order accuracy, lead time consistency, and variance data into a single reference point for each vendor. It gives you an objective basis for decisions about who to prioritize, renegotiate with, or replace.
Best Practices for Retail Inventory Control Reporting
Good reporting habits matter, but the right tools make them sustainable. Here are the best practices that keep your inventory reporting accurate and useful over time.
Start with a Physical Baseline Count
Before you trust any number your software produces, you need to verify it against a physical count of your actual stock. A retail POS system or inventory management platform is only as accurate as the data you feed into it at the start.
Keep Your Dashboard Simple and Visual
Your POS reporting and analytics software should surface the metrics that matter most at a glance, without burying them in rows of raw data. Color-coded alerts for low stock, high variance, or aging products help you and your team spot issues without having to read every report line by line.
Discover Advanced Analytics and Custom Reports
Speak with a product specialist and learn how KORONA POS can work for your business.
Commit to Consistent Reporting Time Frames
One of the most common mistakes retailers make is pulling reports across different date ranges and then comparing the results. Set a fixed reporting cadence in your inventory management system and stick to it so your data stays comparable period over period.
Automate Report Delivery
A good POS or inventory management system lets you schedule reports to run automatically and deliver to the right inboxes without anyone having to remember to pull them. Automation removes the delay between a problem appearing in your data and the person who needs to act on it actually seeing it.
Reconcile Reports with Financial Statements
At the end of every accounting period, your inventory report figures should match what appears on your balance sheet and income statement. Most modern inventory management platforms include inventory reconciliation tools that flag discrepancies before they create problems at audit time.
Conclusion
Inventory control reports are not a back-office task you do when things go wrong. They are the operational backbone of a retail business that wants to grow without losing margin or disappointing customers.
Retailers who use these reports effectively do not just track what they have. They use the data to buy smarter, negotiate harder, plan further ahead, and catch problems before they cost real money.
Start with the reports that give you the most immediate visibility, build a consistent cadence, and choose the best POS or inventory management system to do the heavy lifting. Every report covered above gives you a clear place to begin.
FAQ:
1. How often should you run an inventory control report?
Run an inventory control report daily for high-volume retail, weekly for mid-sized stores, and monthly for low-turnover businesses. Real-time POS systems like KORONA POS automate this process, giving you up-to-date stock visibility whenever you need it — no manual scheduling required.
2. What’s the difference between an inventory control report and an inventory audit?
An inventory control report is an ongoing document tracking stock levels, movement, and value in real time. An inventory audit is a formal, periodic verification of physical stock against recorded data. Think of control reports as daily monitoring; audits are the annual check-up.
3. How do you create an inventory control report in Excel or Google Sheets?
To create an inventory control report in Excel, set up columns for SKU, product name, quantity on hand, reorder point, unit cost, and total value. Update it regularly to track stock movement. For accuracy and automation, upgrade to inventory management software like KORONA POS.
4. What KPIs should be included in an inventory control report?
A strong inventory control report should include inventory turnover rate, stock-on-hand value, sell-through rate, reorder points, shrinkage rate, and GMROI (Gross Margin Return on Investment). These KPIs give retailers actionable insight to reduce dead stock, prevent stockouts, and maximize profitability.
5. How does an inventory control report help prevent shrinkage and loss?
Inventory control reports highlight discrepancies between recorded and actual stock levels, flagging potential theft, damage, or administrative errors early. Regular reporting creates an auditable stock trail, making shrinkage easier to detect and investigate — helping retailers protect margins and reduce preventable inventory loss.