
Every retailer and restaurant operator eventually hits the same wall. Sales are happening, the register is ringing, but the numbers you actually need to make decisions are scattered across receipts, spreadsheets, and a rudimentary dashboard. A strong store reporting solution fixes that by pulling sales, inventory, labor, and customer data into a single view and telling you what to do about it.
The challenge is that every POS vendor claims to have great reporting. Some genuinely do. Others hide the useful reports behind higher-tier plans, long contracts, or third-party apps.
The seven platforms below cover the range of what is on the market in 2026, from free plans for solo sellers to enterprise-grade reporting for multi-unit restaurants and retail chains.
Key Takeaways:
- The best store reporting solution is the one that fits your vertical, not the one with the longest feature list. Match the reporting depth to how your business actually sells.
- Headline pricing rarely reflects what you will pay. Price out 12 full months at your real sales volume before you sign anything, especially with vendors that lock you into 36-month contracts.
- Prioritize responsive human support when a number looks wrong. A beautiful dashboard means nothing if nobody answers the phone at 8 p.m. on a Friday.
Here is how they compare at a glance, followed by a closer look at each one.
POS Reporting Comparison Table
| POS Platform | Best For | Starting Price | Key Reporting Strength |
|---|---|---|---|
| Lightspeed Retail | Growing retailers with complex inventory | $89/mo (annual) | 40+ built-in sales, stock, and profit reports with Lightspeed Analytics |
| Loyverse | Small cafés, food trucks, solo retailers | Free | Free mobile dashboard app with sales and employee reports |
| SpotOn | Full-service restaurants, bars, multi-unit groups | $0/mo (Quick Start) | 90+ curated restaurant reports with visual dashboards and alerts |
| Square | Solo sellers, startups, micro-businesses | Free | Balance-sheet-style sales summary with trends and payment method breakdowns |
| KORONA POS | Retail, liquor, convenience, ticketing, museums | $59/terminal/mo | ABC product analysis, multi-location KPI comparison, customizable KORONA Studio dashboard |
| Shopify POS | Omnichannel and online-first retailers | $39/mo | Unified online + in-store reporting with a 500+ analytics app ecosystem |
| Clover | Brick-and-mortar shops wanting all-in-one hardware | $14.95/mo + hardware | Industry-specific dashboards across six verticals with QuickBooks sync |
1. Lightspeed Retail: Best for Retailers with Multi-Variant Inventory
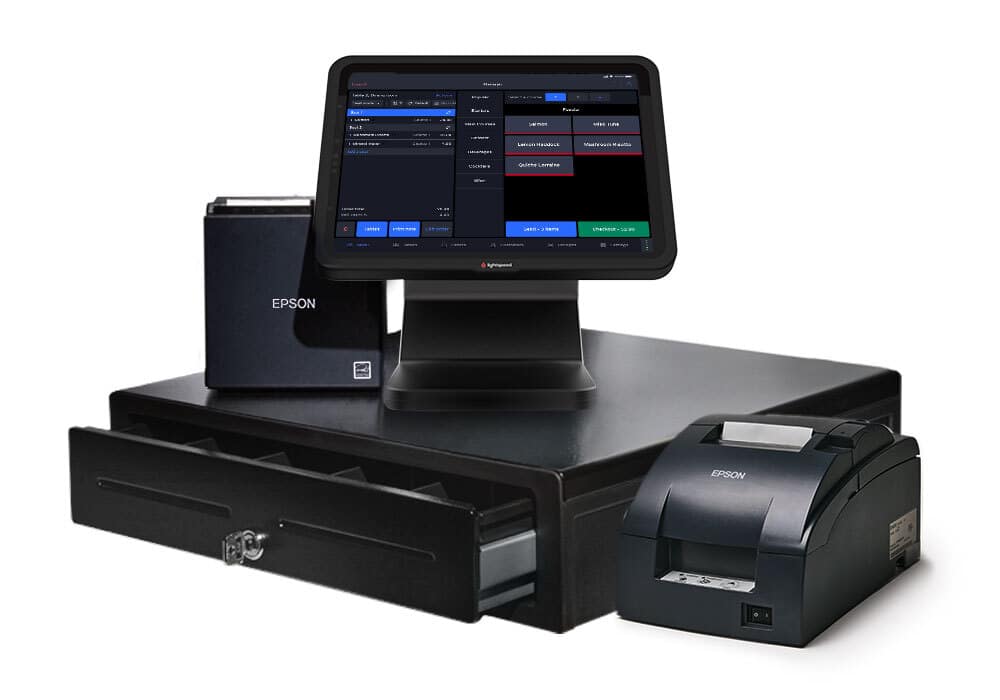
Lightspeed Retail is a cloud-based POS and commerce platform built for inventory-heavy retailers who need serious reporting firepower at scale. It combines 40+ pre-built reports with a dedicated analytics engine, Lightspeed Insights, that turns raw store data into recommendations on pricing, purchasing, and customer targeting.
Key features
Lightspeed’s retail reporting suite covers sales, stock, staff, and marketing performance in a single dashboard, with custom reports and AI-driven forecasting reserved for the higher tiers.
Lightspeed Analytics with guided insights
Lightspeed Analytics analyzes your sales and inventory data, flags slow-moving stock, highlights top customers, and gives clear tips to grow revenue.
40+ built-in sales, stock, and profit reports
Every plan ships with 40+ out-of-the-box reports covering items sold, total sales, gross profits, stock movement, and multi-location performance.
Employee performance & discount tracking
Retailers can drill into sales per employee, average transaction value, and discount usage across every shift. Lightspeed illuminates which staff members drive the highest ticket values, so when rush hours hit, managers can shape schedules.
Where Lightspeed Retail shines
- Deep inventory-linked reporting: Reports tie directly to the matrix inventory.
- Omnichannel reporting out of the box: Since eCommerce ships with every plan, in-store and online sales sit in the same reports without extra setup or third-party sync tools.
- Forecasting and custom reports on Plus: The Plus tier adds Lightspeed Insights forecasting, order recommendations, and saved custom reports that can be emailed to managers on a schedule.
Where Lightspeed Retail falls short
- Higher price point than competitors: Plans start at $89/month (annual billing), and custom reporting and forecasting are available only in the $289/month Plus tier, which is steep for small retailers.
- Third-party processor penalty: If you skip Lightspeed Payments and use your own processor, a monthly surcharge applies, which quietly erodes any ROI gains from sharper reporting.
- The reporting UI can feel clunky: G2 reviewers note that it takes more clicks than modern alternatives when working with large datasets or custom filters.
Customer reviews
One Lightspeed Retail user on G2 praised the system’s efficient checkout, easy inventory tracking, and outstanding help support.
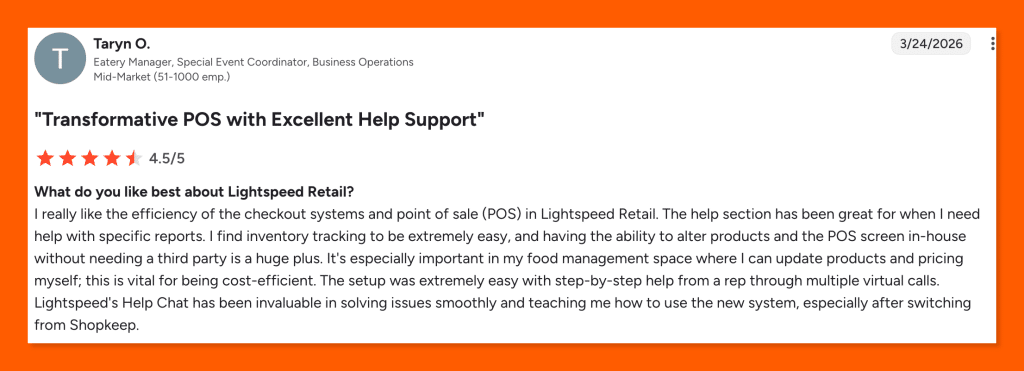
Source: Lightspeed G2
On the other hand, another user on G2 pointed out that Lightspeed Retail’s account management is a serious drawback, with unresponsive managers, unfulfilled discount promises, and unprofessional lending staff.
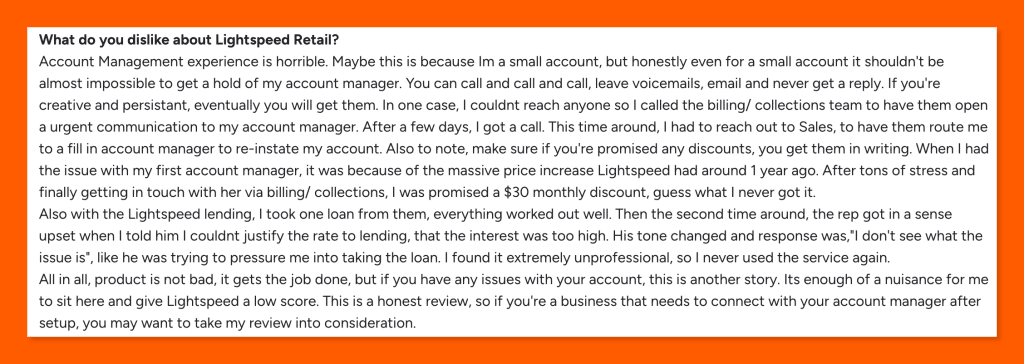
Source: Lightspeed G2
Who Lightspeed Retail is best for
- Apparel, footwear, and accessories retailers: Matrix inventory feeds directly into variant-level reporting, so stores tracking size, color, and season can see sell-through performance on every SKU.
- Bike, sporting goods, and specialty retailers: Retailers carrying thousands of parts and brand variants benefit from deep reports on stock turns, vendor performance, and repair service orders.
- Multi-location and midsize chains: Centralized reporting across stores, combined with Plus-tier Insights forecasting, suits growing retailers that need consolidated KPIs across every storefront.
- Omnichannel sellers: Since eCommerce ships with every plan, reports unify in-store and online sales without a third-party sync layer.
Pricing
Lightspeed Retail starts at $89/month on the Basic plan (billed annually) and scales up to $289/month on Plus. Users paying annually save over those paying monthly. Additionally, Lightspeed charges a significant premium on software fees for merchants that opt of Lightspeed Payments.
Extra registers and additional locations are priced separately. Full details can be found on the Lightspeed Retail pricing page.
| Plan | Price | Key Reporting Features |
|---|---|---|
| Basic | $89/mo (annual billing) | Standard sales, staff, and inventory reports; built-in basic eCommerce; 1 register included; 24/7 chat support |
| Core | $149/mo (annual billing) | All Basic features + advanced sales, staff, and inventory reports; accounting, eCommerce, and marketing integrations; in-store and online loyalty |
| Plus | $289/mo (annual billing) | All Core features + Insights (forecasting, order recommendations, custom reporting); API access; workflows; custom user roles; 24/7 phone support |
2. Loyverse: Best for Single-Location Retailers
Loyverse is a freemium cloud POS built for small independents who want solid reporting without a subscription fee. Though lacking the functionality needed for more complex or larger businesses, the core Loyverse POS, Dashboard, Kitchen Display, and Customer Display apps are free, with paid add-ons available only for businesses that need deeper inventory tools or staff-level permissions.
Key features
Loyverse’s reporting lives in two places: the web Back Office for deeper analysis, and the free Loyverse Dashboard mobile app for sales tracking on the go. Both are included at no cost.
Free Loyverse Dashboard mobile app
The Dashboard app gives owners free iOS and Android access to sales summaries, top-selling items, employee performance, and stock levels from anywhere. Many small business owners check it mid-shift to gauge revenue, spot low stock, or track average ticket size without touching the POS terminal.
Sales analytics across time frames
The back-office breaks down revenue, profit, and average transaction value across daily, weekly, monthly, and yearly views. Owners can spot seasonal trends, compare periods side-by-side, and flag weeks when promotions underperformed. Its analytics cover gross revenue, taxes, tips, discounts, and refunds in a single layout.
Sales by item, category & payment type
Retailers get insight into sales by specific item, category, or payment type to see which products drive the most margin and which payment methods customers prefer. The item-level data helps small shops cut slow movers, push best sellers harder, and reconcile cash versus card totals at close.
Employee performance & shift reports
With the Employee Management add-on, Loyverse tracks sales per employee, shift totals, and cash drawer reconciliation at clock-out. Owners can compare staff productivity, identify top performers for bonuses, and catch cash discrepancies early. Shift reports also print directly from a receipt printer at shift close.
Where Loyverse POS shines
- Genuinely free core reporting: Sales summaries, time-frame analytics, sales-by-item, and inventory alerts cost nothing on the free plan, which is rare across the POS space.
- Flexible hardware setup: Loyverse works on any iOS or Android tablet and pairs with standard receipt printers, cash drawers, and barcode scanners, so startup costs stay low.
- Processor freedom: Loyverse integrates with SumUp, Shift4, Zettle, Tyro, and Yoco, so merchants can choose the best card rates for their market without changing POS software.
Where Loyverse POS falls short
- Limited sales history without a paid add-on: Free accounts only see recent sales data. Extended history and spreadsheet export require the $5/month Unlimited Sales History add-on per store.
- Light on advanced retail reports: The reports are light on matrix inventory, vendor performance, and margin deep dives. Multi-variant operations like hardware stores will quickly outgrow it.
- No built-in eCommerce reporting: Loyverse covers in-store sales only, so omnichannel retailers have to stitch together separate tools for online performance.
Customer reviews
One Loyverse POS user on Trustpilot praised the support team’s patience, clarity, and step-by-step guidance in resolving her issue.
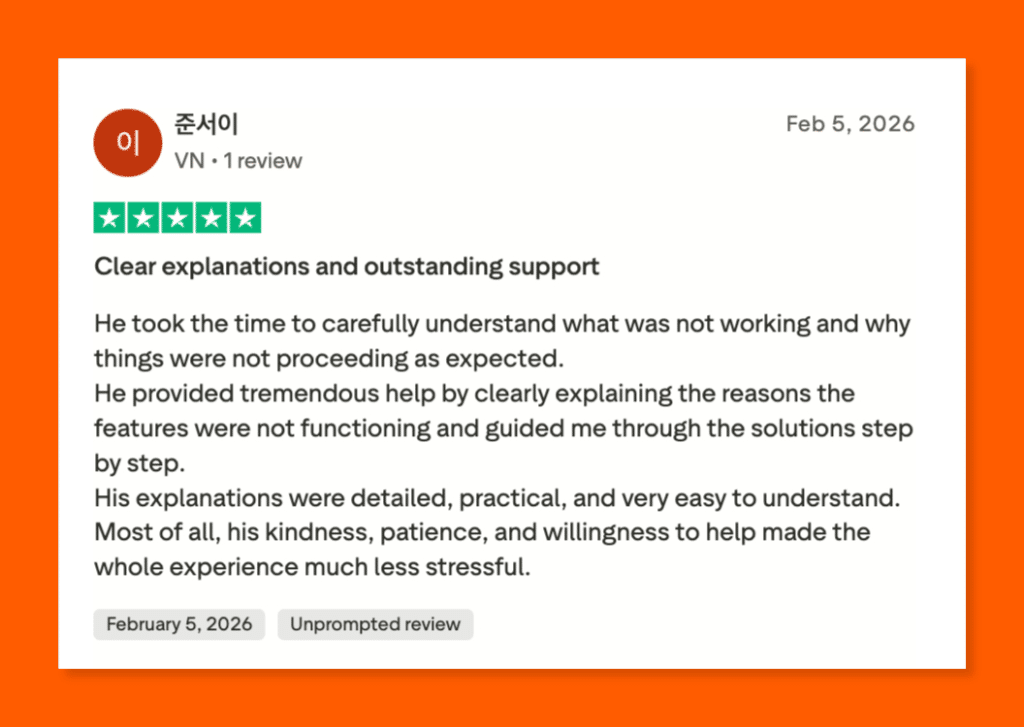
Source: Loyverse Trustpilot
On the other hand, another user on Trustpilot claimed that Loyverse POS deducted money from his account without notice and stopped responding after he provided proof.
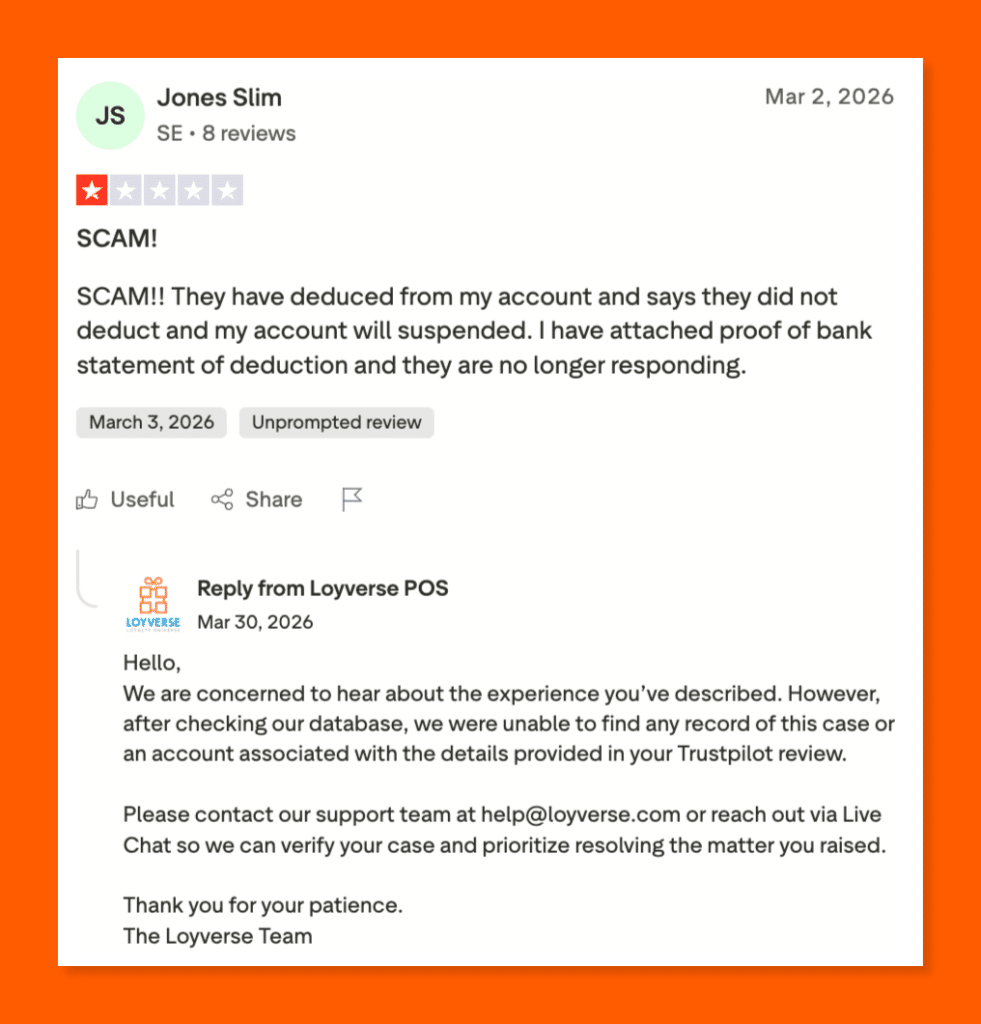
Source: Loyverse Trustpilot
Who Loyverse POS is best for
- Single-location cafés, bakeries, and food trucks: Free KDS, sales trends by daypart, and simple cash reporting cover everyday needs without a subscription cost.
- Small retail shops and boutiques: Owners managing a few hundred SKUs get useful reports on best sellers, categories, and payment types at zero cost.
- Pop-ups, market vendors, and mobile sellers: Offline POS mode and the free Dashboard app give on-the-road operators visibility into daily sales without a laptop.
- Salons, kiosks, and low-volume service businesses: Sales-by-employee data from the Employee Management add-on helps owners see which stylists or staff drive the most revenue.
Pricing
Loyverse’s core POS, Dashboard, KDS, and Customer Display apps are all free with no contracts, no credit card required, and no transaction fees.
Paid add-ons layer on longer sales history and staff permissions at $5 to $25 per store per month, with annual billing offering 2 months free. Each add-on includes a 14-day free trial. Check out the Loyverse pricing page for more details.
| Plan / Add-On | Price | Key Reporting Features |
|---|---|---|
| Loyverse POS (Core apps) | Free | Sales summary, sales trends by day/week/month/year, sales by item, sales by employee, stock alerts, free Dashboard mobile app |
| Unlimited Sales History | $5/mo per store ($50/yr) | Full sales reports for any time period, spreadsheet export of sales data for external analysis |
| Employee Management | $25/mo per store ($250/yr) | Access rights and permissions, timecards, detailed sales tracking by individual employee |
3. SpotOn: Best for Full-Service Restaurants, Bars, and Breweries
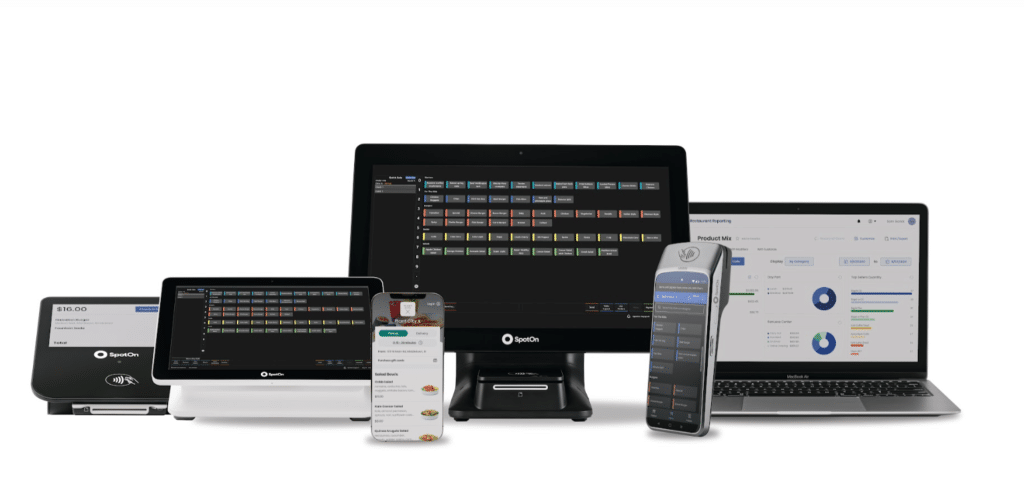
SpotOn is a restaurant-first POS and reporting platform built around 90+ pre-built reports and a visual dashboard that keeps owners on top of sales, labor, and guest trends. Named the #1 Restaurant POS by G2 in Winter 2026, it pairs deep reporting with 24/7 phone support and no long-term contracts.
Key features
SpotOn’s restaurant reporting suite gives operators 90+ curated reports out of the box, visual dashboards, threshold alerts, and a mobile reporting app built specifically for hospitality workflows.
90+ curated restaurant reports
SpotOn ships with 90+ pre-built reports. The list includes product mix analysis (PMIX), daily sales, labor costs, end-of-day closeouts, deposit reconciliations, house accounts, and payroll. Operators don’t need to build custom reports to get useful answers. Filters cover hourly sales, dine-in versus takeout, and cross-location performance.
At-a-glance visual dashboards
The reporting dashboard translates sales, labor, and guest counts into graphs and charts across custom date ranges. Owners can spot peaks, slumps, and anomalies without having to read through rows of numbers. The visual layout helps busy operators act on what the data shows between services or during a quick break.
Alerts and scheduled email reports
Owners can set threshold alerts for labor costs, hours worked, or sales so they receive a ping when a threshold is crossed. Report subscriptions let managers receive daily or weekly recaps in their inboxes, cutting the time spent logging into the back office to get the same numbers.
SpotOn Restaurant Reports mobile app
The dedicated SpotOn Restaurant Reports app for iOS and Android gives owners full access to their reporting suite on the go. Many owners review daily recaps from home, check hourly sales during a commute, or approve closeouts without sitting in the back office every night.
Where SpotOn shines
- Hospitality-focused reporting: Every report is built for restaurant workflows like PMIX, modifiers, discounts, and labor ratios, rather than retrofitted from a retail template.
- Multi-unit reporting baked in: Restaurant groups can view sales, labor, and guest metrics across all locations in a single dashboard, without buying a separate BI tool.
- Strong third-party reporting integrations: SpotOn integrates with QuickBooks, Gusto, Restaurant365, and MarginEdge, so accounting, inventory, and scheduling data align cleanly with POS sales figures.
Where SpotOn falls short
- Multiple logins and sub-apps: Capterra reviewers note that reporting, marketing, loyalty, and online ordering each live behind separate portals, which slows operators as they switch between views.
- Hardware lock-in: Operators can’t bring their own tablets. SpotOn requires its proprietary POS hardware, which adds upfront costs for new restaurants.
- Retail reporting lags restaurant reporting: SpotOn offers a small-business retail POS, but the reporting depth is behind the restaurant product. Retail owners get fewer pre-built insights.
Customer reviews
A Trustpilot reviewer credited SpotOn’s representative Ivan Monroy for seamlessly integrating their online ordering, loyalty program, and kitchen display system.
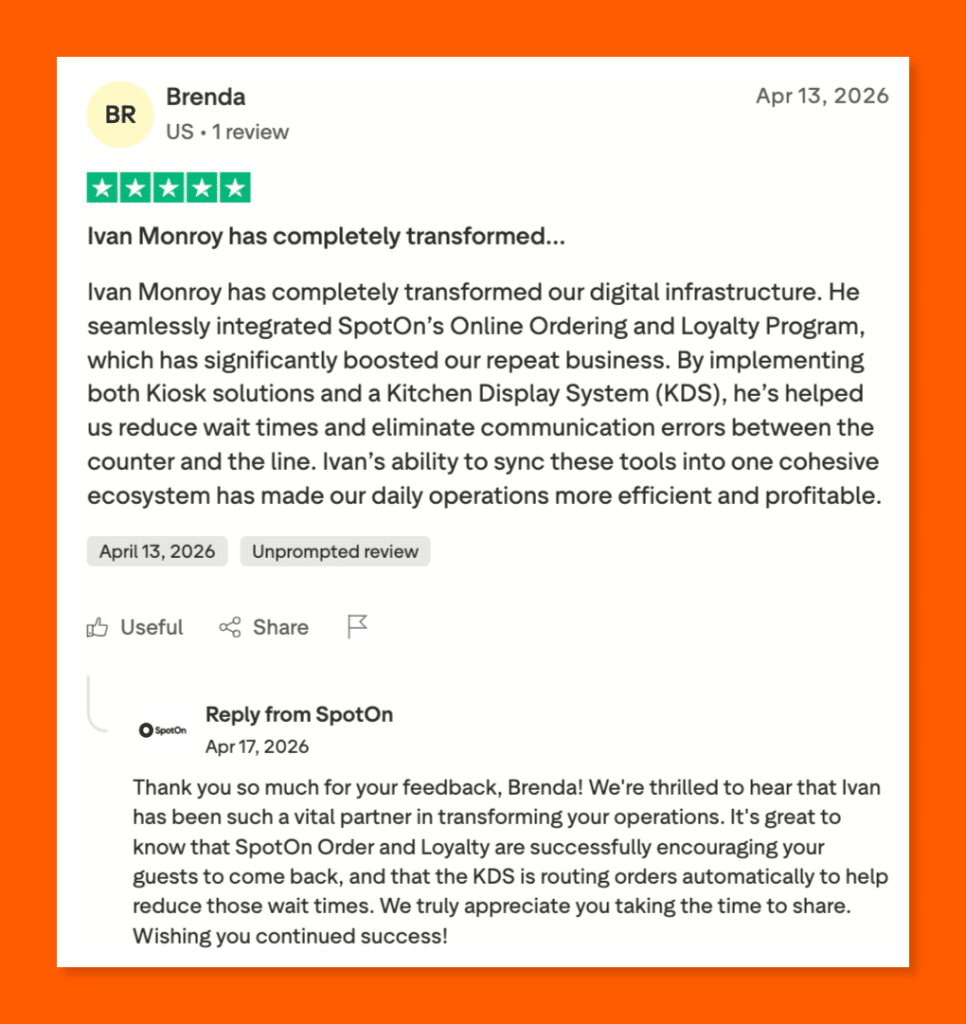
Source: SpotOn Trustpilot
Not everyone shares that experience. A frustrated Trustpilot user reported canceled DoorDash orders, a broken ordering app, and unhelpful support that never resolved his issues.
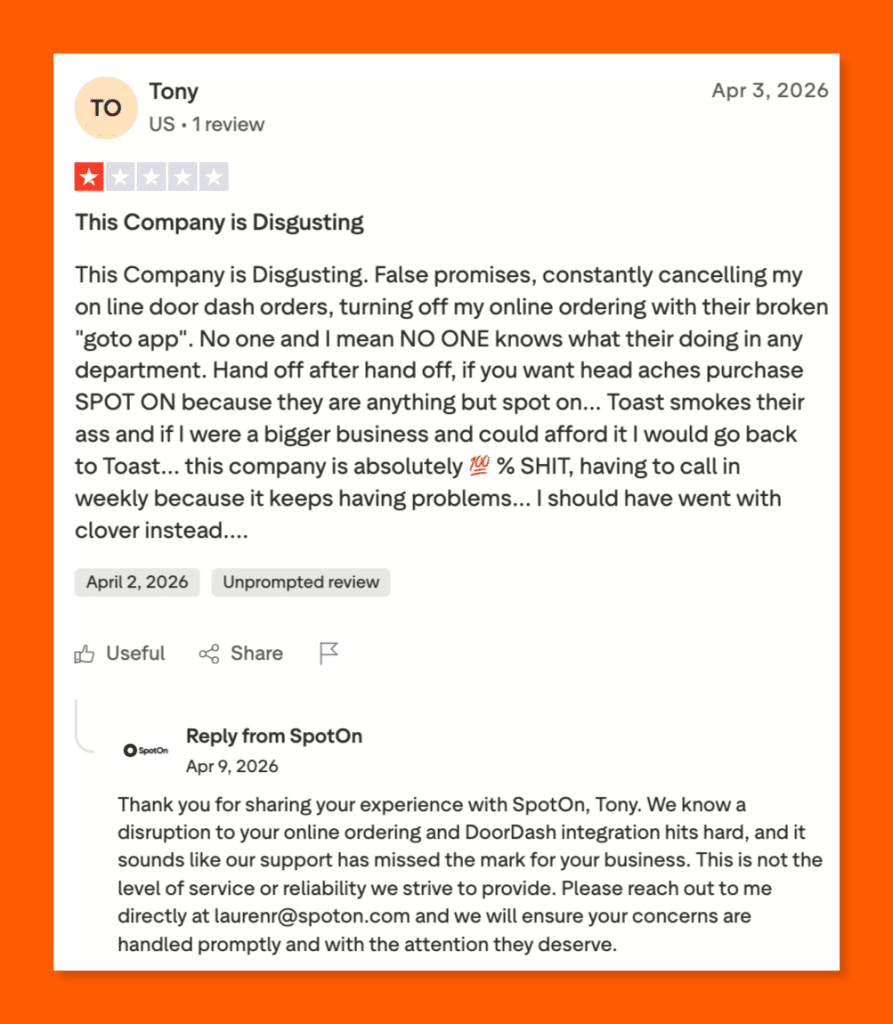
Source: SpotOn Trustpilot
Who SpotOn is best for
- Full-service restaurants and fine dining: Menu modifier depth, tableside reporting, and PMIX analysis support complex kitchen and service workflows.
- Bars, breweries, and nightclubs: Hospitality-specific reports cover bar comps, bottle-level sales, and shift-by-shift cash reconciliation, which bar managers use to fine-tune pours and pricing.
- Multi-unit restaurant groups: Enterprise reporting rolls up sales and labor across all locations, so consolidated KPIs and cross-store comparisons remain straightforward for the back office.
- Operators who want a full ecosystem: Reservations, loyalty, online ordering, payroll, and scheduling all tie into the same reporting dashboard, so owners don’t need to stitch together third-party reports.
Pricing
SpotOn offers transparent pricing with no long-term contracts or hidden fees.
The Quick Start plan is free every month and bundles software, hardware, and setup into a higher processing rate. POS Essentials runs $55 per station per month with lower card-present rates. The Core Bundle adds SpotOn’s profit, ordering, and marketing tools for $50 per month plus a small processing percentage.
Find more details on the SpotOn pricing page.
| Plan | Price | Key Reporting Features |
|---|---|---|
| Quick Start | $0/mo + 2.79% + 20¢ processing | Full POS essentials, 90+ built-in reports, 24/7 support, no upfront hardware or software cost (processing minimums apply) |
| POS Essentials | $55/station per month + 2.45% + 15¢ card-present | Ordering, payments, table layouts, menu management, 90+ reports, visual dashboards, alerts & email subscriptions |
| Core Bundle | $50/mo + 20bps (capped at $200) | All POS Essentials reporting + SpotOn Profit Assist (AI P&L analysis), SpotOn Order, GoTo Place app, Marketing Assist, integrations |
| Build Your Own | Custom pricing | Tailored reporting bundle for multi-unit groups, with optional cost analysis, KDS, scheduling, loyalty, and enterprise reporting add-ons |
4. Square: Best for Solo Sellers, Startups, and Micro-Businesses
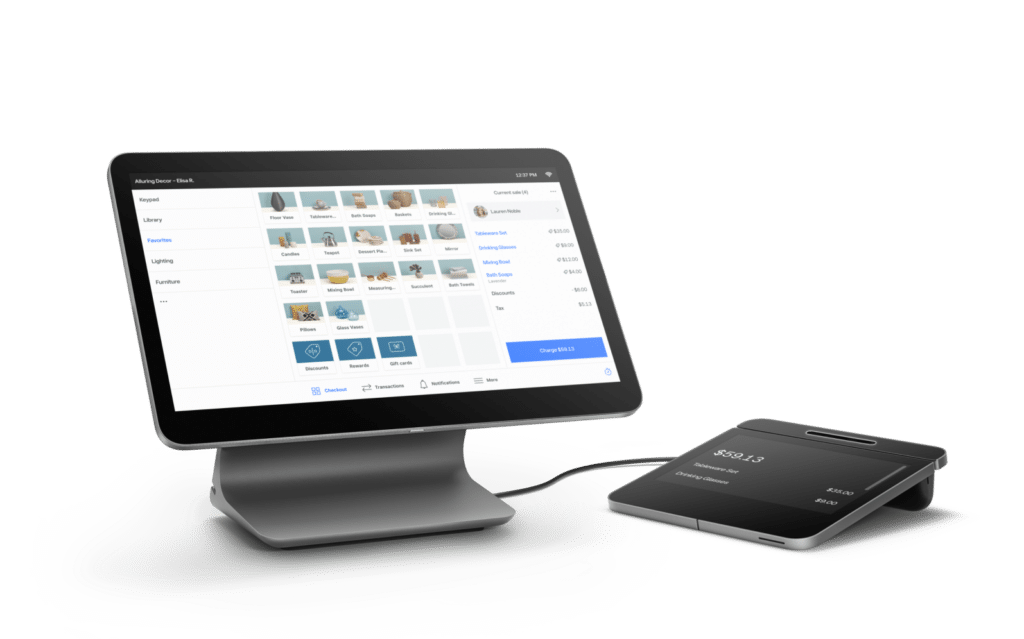
Square is a cloud-based POS platform that made reporting accessible to any business with a phone and a free card reader. The Free plan still ships with the core sales summary, sales trends, payment methods, and reconciliation reports built into the Square Dashboard, with paid tiers adding advanced reporting and lower processing rates.
Key features
Square’s in-app summaries and reports pull sales, payments, and accounting data into a single dashboard, with a balance-sheet-style sales summary at the core and filters that match how you actually run your day.
Sales Summary report (balance-sheet view)
Square’s Sales Summary pulls gross sales, discounts, comps, net sales, taxes, tips, gift card sales, and fees into one balance-sheet-style report. Owners can filter by location, device, channel, or team member, and group data by hour, day, week, or month. Print, export, or email reports straight from the dashboard.
Sales Trends report with period comparison
Square’s Sales Trends report lets you compare gross sales, net sales, average ticket size, and order counts across two time periods side by side. Choose between line and bar graphs, layer in channel filters, and set a custom workweek so your reports match how you actually operate.
Payment Methods breakdown
The Payment Methods report splits totals by card brand, debit versus credit, and domestic versus international cards, along with refund amounts, fees, tips, and net totals. The view helps owners see which tender types drive the most volume and whether international cards or refunds quietly eat into margin.
Accounting & reconciliation reports
The Reconciliation Report explains exactly how Square calculates the amount transferred to your bank. It consolidates total payments collected, refunds, partial payments, and split deposits into a single view, simplifying monthly accounting. Owners handling weekly bookkeeping can align transfer schedules with reporting days for clean month-end closeouts.
Where Square shines
- Zero barrier to entry: The Free plan ships with full reporting, so new and micro-businesses get Sales Summary, Sales Trends, and Payment Methods reports at no cost.
- Beginner-friendly dashboard: Reports are organized in plain language with metric definitions built in, so owners without accounting backgrounds can still read the numbers with confidence.
- Multichannel data in one place: Square rolls up in-person, online store, invoice, virtual terminal, and Tap to Pay sales into the same reports, so omnichannel sellers don’t need a separate tool.
Where Square falls short
- Advanced reporting costs extra: Vendor sales, item-level detail beyond the category level, and advanced team reports sit behind the Plus ($49) and Premium ($149) per-location plans, which adds up fast for multi-location owners.
- No true custom report builder: Square offers pre-built reports with filters, but operators who need column-by-column custom reporting often reach for a third-party app from the Square Marketplace.
- Account stability risk for higher-risk merchants: High-volume or unusual transactions can trigger fund holds, which disrupts cash flow even when reporting itself is accurate.
Customer reviews
A Trustpilot reviewer praised Square for its user-friendly setup, allowing her to start accepting payments almost immediately.
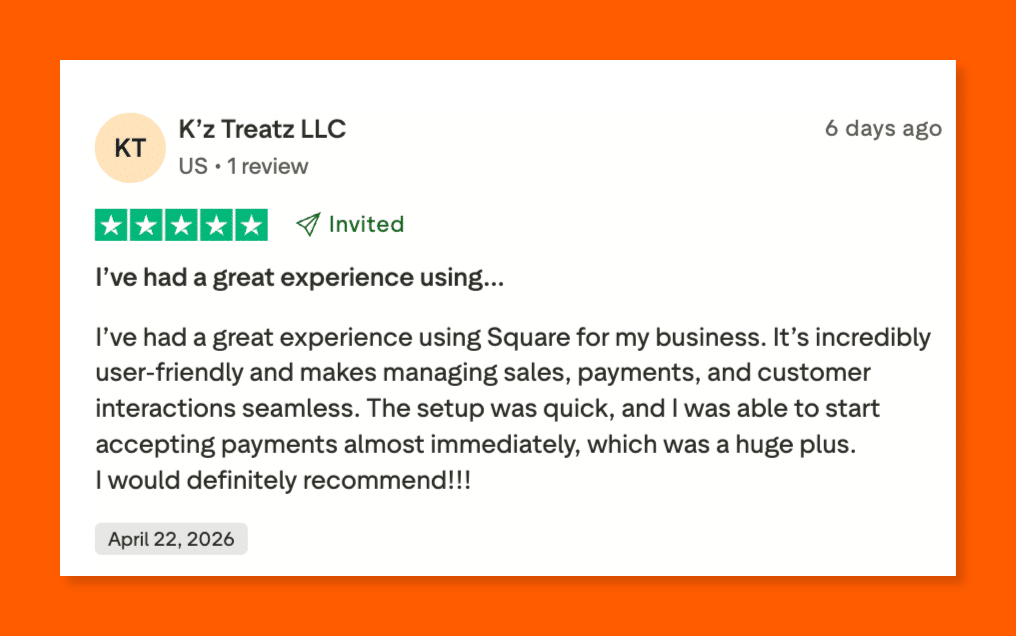
Source: Square POS Trustpilot
A Reddit user in r/smallbusiness tells a different story. Square abruptly closed his account mid-day with no warning, freezing his funds and leaving his small business on the verge of bankruptcy.
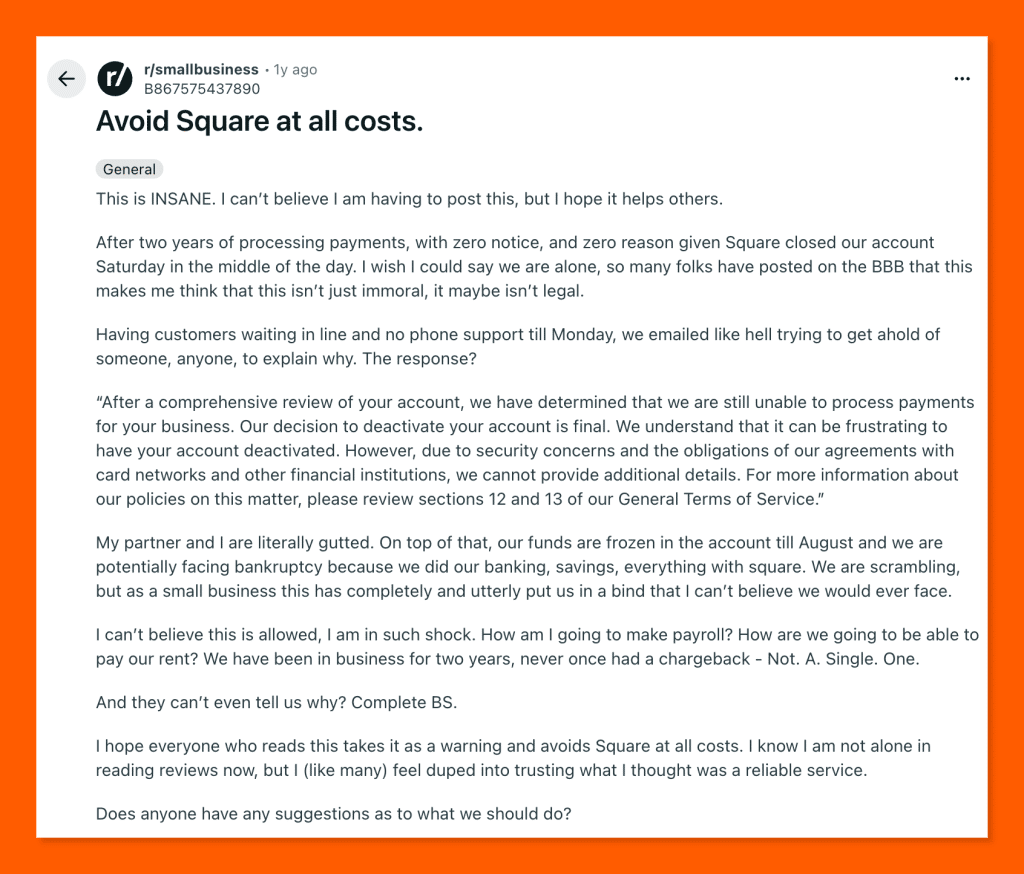
Source: Square POS Reddit
Who Square is best for
- Solo sellers, startups, and micro-businesses: The Free plan covers sales summaries, trends, and payment methods reports at zero monthly cost, which fits new ventures that want reporting without a subscription.
- Food trucks, market vendors, and pop-ups: Tap to Pay and the mobile POS app give mobile operators full reporting access from a phone, including the past 90 days of sales history in-app.
- Appointment and service businesses: Hair stylists, trainers, and freelancers can pull sales summaries by service, staff member, or channel straight from the Square Dashboard.
- Omnichannel small retailers: In-store, online, invoice, and Tap to Pay sales all flow into the same Sales Summary report, so unified reporting stays simple.
Pricing
Square runs a Free plan with no monthly fee and two paid tiers that offer lower processing rates and advanced reporting. Plus and Premium plans are priced per location and include features like cross-location returns, advanced team reports, and 24/7 phone support on Premium.
Businesses processing over $250,000 per year can request custom pricing. All plans are month-to-month with no contracts.
The Square pricing page shares more details.
| Plan | Price | Key Reporting Features |
|---|---|---|
| Free | $0/mo + 2.6% + 15¢ in-person / 3.3% + 30¢ online | Sales Summary, Sales Trends, Payment Methods, Reconciliation reports, in-app POS reporting for the past 90 days, free magstripe card reader |
| Plus | $49/mo per location + 2.5% + 15¢ in-person / 2.9% + 30¢ online | All Free reports + advanced team management and inventory reports, priority email and chat support |
| Premium | $149/mo per location + 2.4% + 15¢ in-person / 2.9% + 30¢ online | All Plus reports + vendor sales reporting, cross-location returns and transfers, advanced custom tools, 24/7 phone support |
| Pro (Custom) | Custom pricing (processing $250K+/year) | All Premium reports + negotiated rates, volume-based discounts, and a dedicated account manager |
5. KORONA POS: Best for High-Inventory Retail
KORONA POS is a cloud-based point of sale platform built specifically for specialty retailers, ticketing venues, and quick-service operators who need deeper reporting than generic dashboards provide.
It stands out by combining processor-agnostic payments, zero contracts, and one of the most granular reporting and analytics suites on the market. And it’s all accessible from anywhere through its cloud-based KORONA Studio back office.
Key features
Every KORONA POS plan includes customizable reporting tools that let retailers drill into product performance, employee productivity, and location-level KPIs without jumping between disconnected apps or spreadsheets.
ABC Product Analysis report
KORONA’s ABC analysis grades every SKU by profitability and movement, so you can identify top sellers, slow movers, and dead stock in seconds. It turns weeks of manual SKU review into an instantaneous, detailed report.
Users can even layer sell-through rates, seasonality, or other on top to refine reordering and tighten margins. It’s one of the most useful tools in KORONA’s retail management software features.
Customizable real-time KORONA Studio
KORONA Studio, the cloud-based back office, is where all reporting lives. Merchants can build a custom dashboard with KPI widgets for hourly sales, average ticket size, conversion rates, and employee performance.
Because it’s fully cloud-hosted, you can pull reports from home, a second location, or a phone. Step-by-step walkthroughs for every report are documented in the KORONA POS Support Manual.
Multi-location & cross-store KPI comparison
With the Plus plan, KORONA POS unlocks organization indicators and cross-store comparison reports. Operators running multiple stores can benchmark sales per square foot, staff productivity, and basket size across locations to spot performance gaps early.
The Plus tier also includes year-over-year reports, slow- and top-seller breakdowns, and depth-of-movement data usually reserved for enterprise retail BI tools.
Where KORONA POS shines
- Depth of reporting at its price point: Few platforms under $100/month bundle ABC analysis, cross-store KPI comparisons, and year-over-year breakdowns.
- Cloud-based access from anywhere: KORONA Studio lets you pull reports from any browser, so multi-location owners aren’t tied to a store computer.
- Processor and hardware freedom: Because KORONA isn’t a payment processor itself, reporting stays consistent even if you switch merchant providers down the road.
- Customizable dashboards and branding: Dashboards, checkout screens, and report layouts can all be tailored, a plus for operators exploring white-label POS setups.
Where KORONA POS falls short
- Learning curve for advanced reports: The depth of customization means new users often need onboarding calls to configure reporting correctly; it’s not a one-click experience.
- Dated UI in spots: Some users note the reporting interface feels slightly older than competitors like Square or Shopify, though core functionality isn’t affected.
- Limited pre-built integrations: KORONA has an open API, but fewer plug-and-play integrations than Square or Shopify.
Customer reviews
A G2 reviewer praised KORONA POS for its real-time inventory tracking, offline reliability, and the convenience of managing multiple stores from one dashboard.
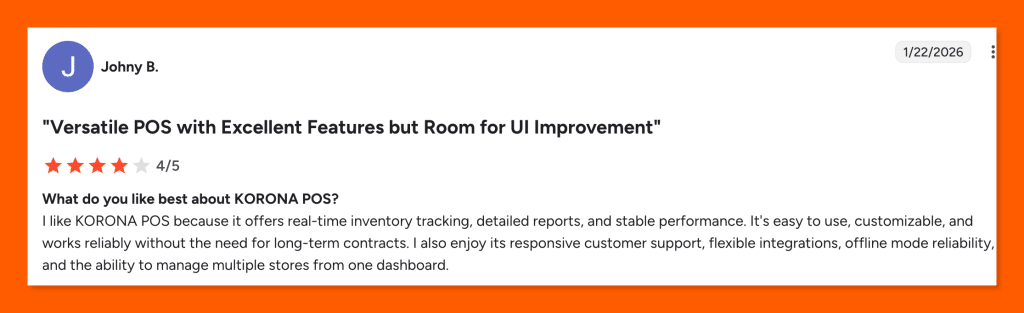
Source: KORONA POS Trustpilot
Meanwhile, a Trustpilot user found that while KORONA POS handles daily operations well, its steep learning curve and limited integration options make it frustrating for more advanced needs.
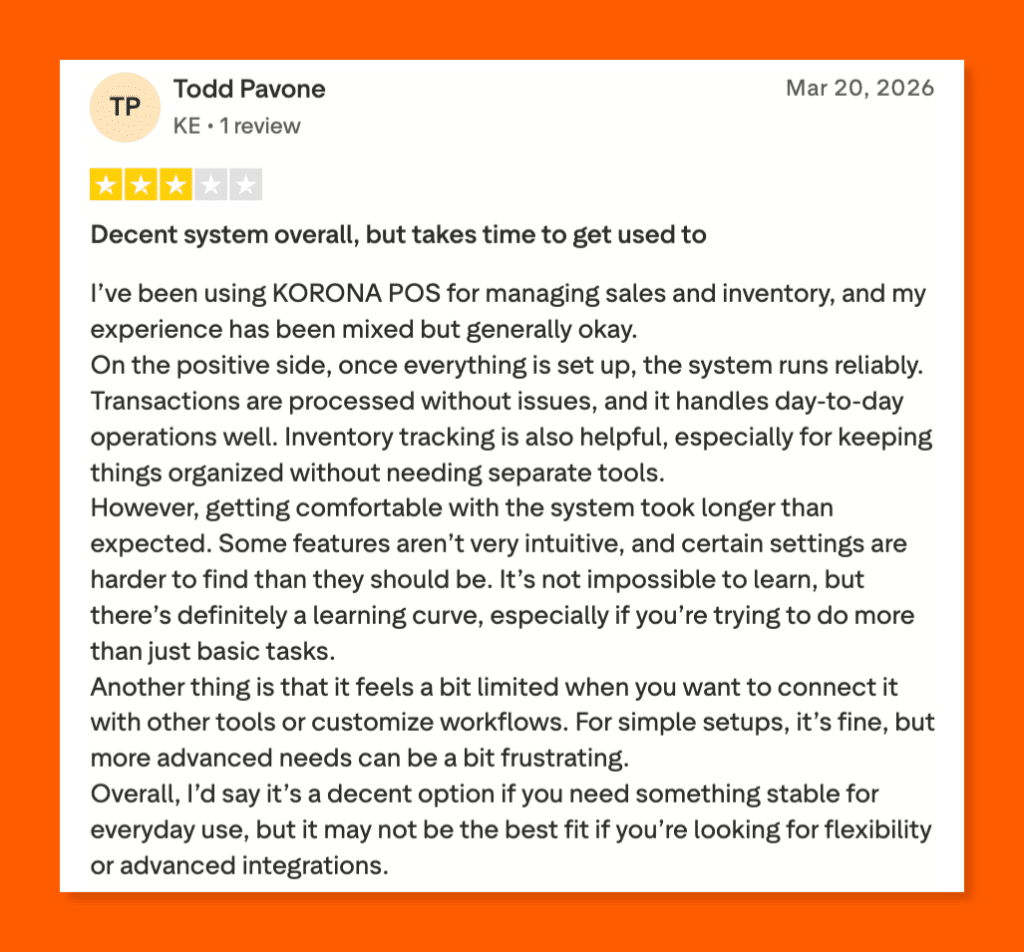
Source: KORONA POS Trustpilot
Who KORONA POS is best for
- Specialty retailers (liquor, vape, smoke shops, convenience stores): Businesses managing large, high-SKU assortments benefit from ABC analysis and SKU-level profitability reports that generic POS dashboards can’t match.
- Museums, amusement parks, and ticketed venues: The ticketing module produces dedicated attendance, membership, and gate-level reports alongside retail analytics — a good fit for operators shopping for the best museum POS system or an online ticketing system.
- Multi-location and franchise operators: Cross-store KPI comparison and centralized dashboards make KORONA a strong fit for chains tracking performance across every location, as well as small business owners who plan to scale.
Speak with a product specialist and learn how KORONA POS can power your business.
Pricing
KORONA POS bills month-to-month with no contracts. Users get more advanced inventory management deeper reporting tools and analytics, and cross-store comparison with higher tiers such as KORONA Retail and. There are no setup fees, and a 30-day software money-back guarantee is included.
Optional modules like KORONA Ticketing (+$50/gate), KORONA Franchise (+$30), and KORONA Food (+$10) can be layered on. Full details are on KORONA’s pricing page.
| Plan | Price | Key Reporting Features |
|---|---|---|
| KORONA POS Core | $59/mo per terminal · No contract | Various KPI reports, customizable dashboard, unlimited users and sales, eCommerce, and gift card reporting, API access |
| KORONA POS Retail | $79/mo per terminal · No contract | All Core features + real-time inventory tracking, stock management reports, supplier and order automation, customer management |
| KORONA POS Plus | $99/mo per terminal · No contract | All Retail features + custom ABC analysis, key performance reports, slow & top sellers, organization indicators & cross-store comparison, movement reports, financial accounting data export |
6. Shopify POS: Best for Omnichannel Sellers
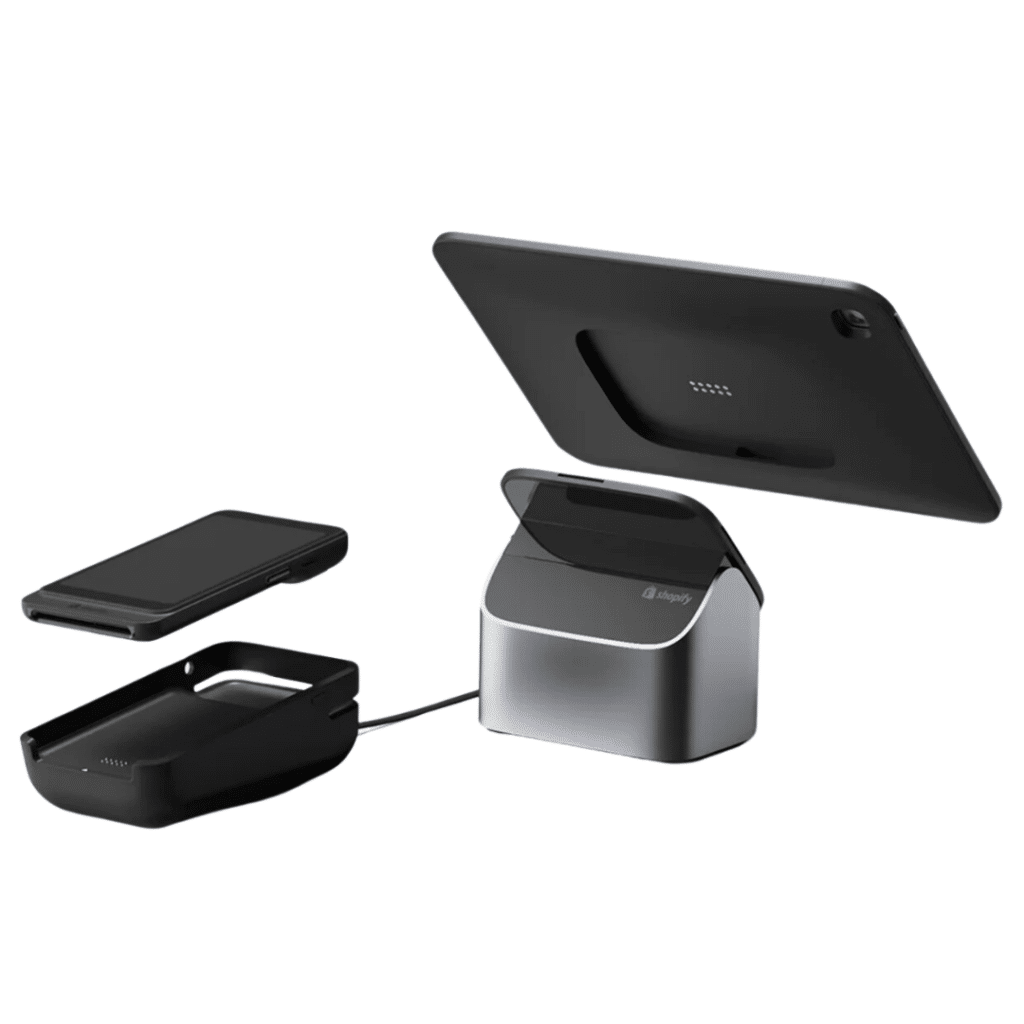
Shopify POS is the in-person extension of Shopify’s eCommerce platform, built to pull online, retail, social, and marketplace sales into one reporting view. The reporting is strongest on omnichannel visibility, with a daily sales snapshot in the POS app and a full retail sales report library inside the Shopify admin.
Key features
Shopify POS splits reporting into two layers: in-app POS analytics for quick at-the-register visibility and the Shopify admin’s Retail Sales library for deeper analysis across product, staff, and location.
Daily sales report in the POS app
The Daily Sales screen in Shopify POS shows net sales, average order value, and items per order at a glance. The report compares today’s numbers to the same day last week, so floor staff and store managers can gauge shift performance without opening a laptop.
Retail sales reports Library
The Shopify admin section includes a dedicated Retail Sales report category with total sales by product, SKU variant, vendor, product type, POS location, and staff at register. The library also supports daily staff sales totals, which helps managers spot top performers and coach slower ones.
Cash tracking & register sessions (POS Pro)
POS Pro adds cash tracking sessions that handle drawer reconciliation, expected vs. counted cash, and transfer logs between registers. Owners can filter sessions by date range and location, export tracking reports to CSV, and monitor cash activity across all stores from the Shopify admin to improve loss prevention.
Unified omnichannel reporting
Every Shopify plan rolls in-store, online store, Shop app, social channels, and marketplace sales into the same admin reports, so lifetime value, product performance, and customer profiles stay consistent whether a shopper bought online, in-store, or via pickup. Merchants can avoid double-counting or manual stitching between systems.
Where Shopify POS shines
- Best-in-class omnichannel reporting: In-store, online, social, and marketplace sales all flow into the same Shopify admin, so reports reflect true business performance rather than a single channel.
- Huge third-party reporting app ecosystem: The Shopify App Store lists 500+ analytics apps for custom dashboards, COGS tracking, or cohort analysis beyond the native reports.
- Strong mobile reporting: Owners can pull the Daily Sales report from their phone, and staff at the register can glance at performance without leaving the POS app.
Where Shopify POS falls short
- Advanced reporting locked behind POS Pro: Staff performance, inventory reports, and retail analytics sit behind the $89/month POS Pro add-on per location, which adds up for multi-store operators.
- Limited offline reporting: Offline mode only covers basic sales. Reports, inventory sync, and integrations pause until internet returns, which several reviewers flag as unreliable during outages.
- Third-party processor penalty: Using a non-Shopify processor triggers an extra 0.6% to 2% fee per transaction, which erodes any card-rate savings you would pick up elsewhere.
Customer reviews
One Shopify POS user on G2 loved how effortlessly it synced with their online store, from inventory tracking to local pickup orders, all set up in under two minutes.
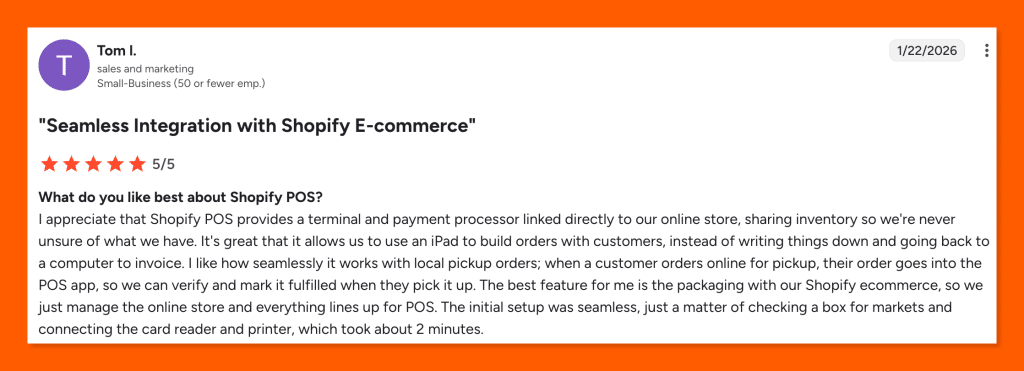
Source: Shopify G2
On Trustpilot, things look very different. A user described being stuck in endless loops with a useless AI assistant, with no human support in sight, and her bank account disconnected, leaving her unable to recover her funds.
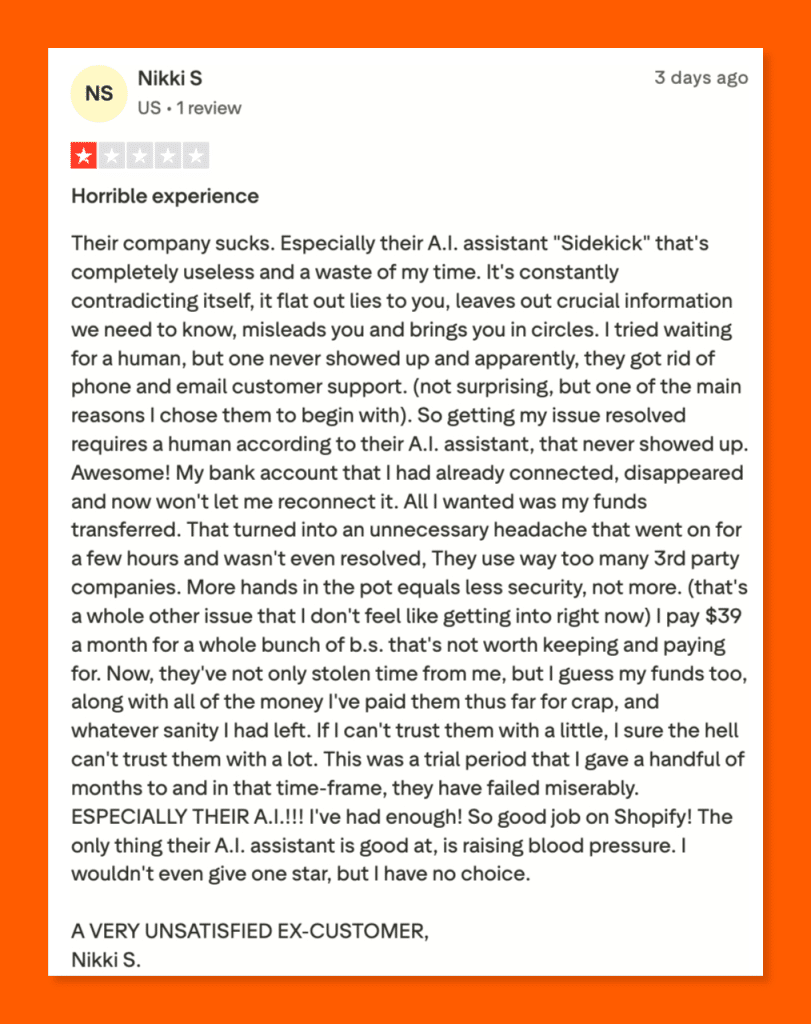
Source: Shopify Trustpilot
Who Shopify POS is best for
- Online-first Shopify merchants expanding to retail: If your eCommerce store is already on Shopify, the POS plugs in with zero data migration, and reports stay unified across channels.
- Multichannel and pop-up retailers: Sellers operating on Shopify, Instagram, TikTok, and marketplaces get a single Shopify admin for sales, customer, and inventory reports across every touchpoint.
- Small retail chains on POS Pro: Multi-location owners who add the $ 89-per-location POS Pro subscription gain staff-level reports, store-level inventory reports, and cash tracking across every register.
- Direct-to-consumer brands with flagship stores: Shopify Plus merchants running enterprise retail operations get rich customer profiles, professional retail reports, and loyalty insights out of the box.
Pricing
Shopify POS pricing combines a base Shopify subscription with an optional POS Pro add-on at $89 per location per month. The Basic plan starts at $39 per month and includes casual in-person selling. Paid plans offer better card rates and more eCommerce tools as you scale. POS Pro adds staff management, inventory reports, retail analytics, and omnichannel selling at any retail location.
Check out Shopify’s pricing for more details.
| Plan | Price | Key Reporting Features |
|---|---|---|
| Basic | $39/mo + 2.6% + 10¢ in-person / 2.9% + 30¢ online | Core Shopify reporting, Daily Sales in-app report, basic Retail Sales reports, simple customer profiles |
| Grow | $105/mo + 2.5% + 10¢ in-person / 2.7% + 30¢ online | All Basic reports + unlimited POS logins, deeper sales and inventory analytics |
| Advanced | $399/mo + 2.4% + 10¢ in-person / 2.5% + 30¢ online | All Grow reports + advanced custom reporting for multi-location operations |
| Plus | $2,300/mo (1- or 3-year term) | Professional retail reports, customer loyalty insights, rich customer profiles, returns at any location, staff roles, and permissions |
| POS Pro (add-on) | +$89/mo per location | Unlimited POS logins, staff roles & permissions, rich customer profiles, loyalty insights, inventory management reports, professional retail reports, cash tracking |
7. Clover: Best for Simple Hardware Bundles

Clover is an all-in-one POS platform built on Fiserv-owned proprietary hardware, with six industry-specific software tiers for retail, restaurants, and services. Reporting runs through the Clover Dashboard (web) and the Clover Go mobile app, so owners get live sales visibility from any browser or phone.
Key features
The Clover Dashboard and mobile app pull sales, payments, inventory, and staff data into a central reporting view, with tax-ready exports and built-in integrations for QuickBooks, Xero, and other accounting and reporting tools.
Clover Dashboard sales tracking
The Clover Dashboard gives owners a running view of total sales, hourly sales, refunds, discounts, and top-selling items. Filters drill into peak hours, best-sellers, and customer spending patterns to guide staffing, inventory, and promotion decisions. The same view is available through the Clover Go mobile app for on-the-go check-ins.
Multi-location consolidated reporting
Operators with multiple stores can consolidate sales across all locations from a single dashboard. The reporting view pulls in-store transactions, Clover Online orders, and cross-location transfers into one report, which helps chain owners compare stores side by side. Filters by location, device, and date range refine the data.
Employee sales & tip Tracking
Clover tracks individual staff sales and tip distribution so owners can see who drives the most revenue and which employees need coaching. Tip reports break down gratuity across servers, bartenders, and kitchen staff for fair payouts. Payment-type reports also show cash, card, and gift card volume by shift.
Accounting integration & tax-ready reports
Clover generates built-in sales and tax reports that sync cleanly with QuickBooks Online, Xero, and other accounting tools. The integrations cut down on manual data entry and keep sales tax jurisdictions organized for filing.
Where Clover shines
- All-in-one hardware and software in one package: Clover ships purpose-built hardware (Station, Mini, Flex, Go) with reporting software pre-installed, so setup takes hours instead of days.
- Six industry-specific plans: Retail, full-service restaurants, quick-service, personal services, professional services, and home/field each get tailored reports like PMIX, revenue centers, appointment history, or service tickets.
- Strong App Market for custom analytics: The Clover App Market adds advanced reporting apps like BusinessQ Analytics, cohort tools, and commission calculators when the native reports aren’t deep enough.
Where Clover falls short
- Hardware and processor lock-in: Clover hardware only runs Clover software tied to Fiserv. If you switch processors, the hardware becomes useless, which reviewers flag as costly when merchants want to leave.
- Long-term contracts and hidden fees: Most plans require 36-month commitments with early termination fees of $500 to $2,000+, and reseller markups can push effective rates to 4% to 5%.
- Reporting split across apps and web: Some reports sit only on the device and others only on the web dashboard, which G2 reviewers call out as inconvenient when they need a quick snapshot.
Customer reviews
A Trustpilot reviewer called Clover’s dashboard the best she’s ever used, also praising its simple setup and helpful reporting tools for her small business.
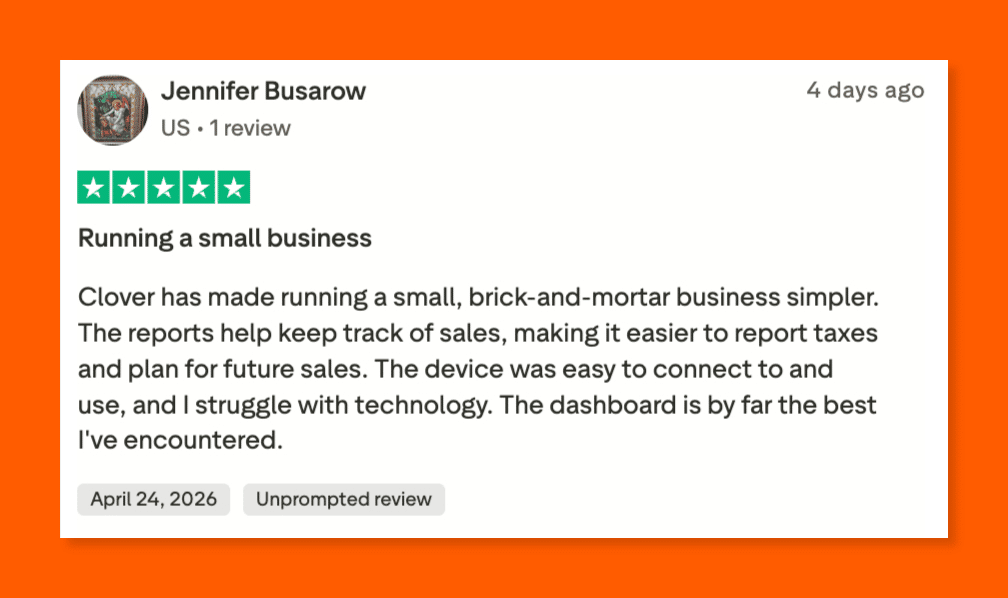
Source: Clover POS Trustpilot
A Reddit user in r/CloverPOS tells a completely different story: two-hour support calls, inconsistent answers, repeated identity checks, and a POS system riddled with limitations.
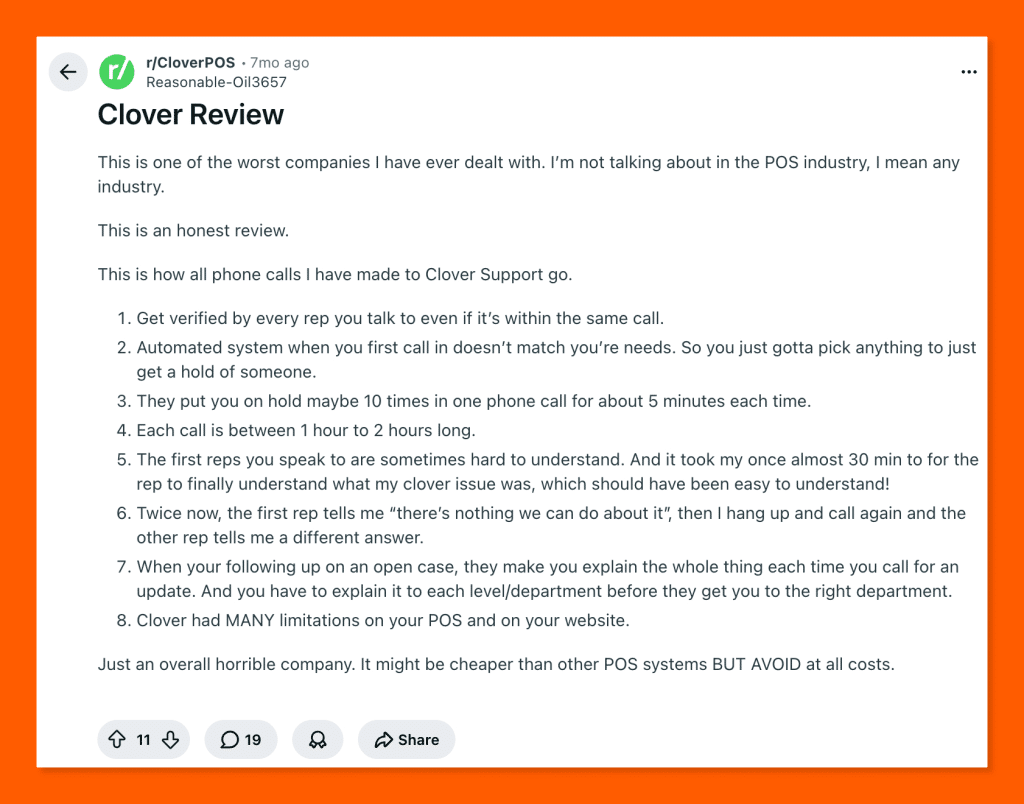
Source: Clover POS Reddit
Who Clover is best for
- Small retail shops and boutiques: Simple sales reporting, inventory tracking, and customer engagement tools suit owners who want POS-in-a-box without heavy configuration.
- Quick-service restaurants and cafés: Live sales, hourly sales, and PMIX reporting give QSR operators clear visibility into throughput, top items, and peak hours.
- Personal service businesses: Salons, barbershops, and health & beauty shops get appointment-tied reports, staff sales, and tip tracking bundled into the dedicated services plan.
- Mobile service providers: Home & field operators (electricians, mobile detailers, event vendors) use Clover Go and Clover Flex for on-site transactions with basic sales reporting from their phone.
Pricing
Clover structures pricing across six business types (retail, quick-service, full-service, personal services, professional services, home & field) with Starter, Standard, and Advanced tiers in each. Software plans range from $0 (payments only) to $354 per month, with hardware devices from $49 (Clover Go) to $1,899 (Station Duo).
Most subscriptions require a 36-month commitment when financed. Processing starts at 2.3% + 10¢ card-present. Full details are on the Clover pricing page.
| Plan Category | Price Range (monthly) | Key Reporting Features |
|---|---|---|
| Payments | $0 | Payment processing only; basic transaction history, no full reporting dashboard |
| Essentials | $14.95/mo | Basic POS reporting, daily sales totals, employee tips, payment type breakdowns |
| Retail (Starter → Advanced) | $16 – $180/mo (36-month financing) | Gross sales, inventory reports, discounts, customer engagement, multi-location dashboard on higher tiers |
| Quick-Service Restaurant | $135 – $245/mo (36-month financing) | Hourly sales, PMIX, employee sales and tips, revenue center reporting, menu mix |
| Full-Service Restaurant | $179 – $354/mo (36-month financing) | All QSR reporting + table management, coursing, revenue centers (bar vs. dining), tip-out, server performance |
| Services (Personal / Professional / Home & Field) | $0 – $84.95/mo | Appointment-tied reports, service ticket history, staff performance, customer profiles |
How to Choose the Right Store Reporting Solution?
Picking a reporting solution is less about who has the flashiest dashboard and more about who answers the questions you ask every day. Before signing a 36-month contract or settling for a free plan, walk through the points below to make sure the system fits your store’s operations.
1. Reporting Depth and Customization
The shallow end of reporting stops at daily sales and top products. Strong platforms go deeper into ABC product analysis, shrinkage tracking, and custom dashboards. Look for tools with filterable metrics, dimensions you can swap in and out, and custom report builders. KORONA’s reporting and analytics suite is a good benchmark for what serious retail reporting looks like.
2. Total Cost of Ownership, Not Just the Headline Price
A $39 monthly subscription can easily turn into $500 once processing fees, hardware, POS Pro add-ons, and third-party integrations are factored in. Before committing, price out 12 months of real usage at your sales volume. Comparison guides like KORONA’s breakdown of the lowest-fee POS systems help you see through flat-rate marketing and weigh interchange-plus alternatives fairly.
3. Multi-Location Consolidation
If you run more than one store, consolidated reporting matters more than almost anything else. A proper multi-store POS system should handle cross-store KPI comparisons without spreadsheets or a separate BI tool bolted on.
4. Inventory-Level Reporting
Sales reporting without inventory reporting only tells half the story. Our guide to multi-store inventory management lays out what to expect from stock reports when you have more than one location to manage.
Discover Advanced Analytics and Custom Reports
Speak with a product specialist and learn how KORONA POS can work for your business.
5. Customer and Loyalty Reporting
Look for reports that track lifetime value, repeat purchase rate, basket size by segment, and loyalty program redemptions. Strong CRM and loyalty tools tie purchase history to individual shoppers.
6. Industry-Specific Report Templates
A generic sales recap will not cut it for a liquor store, a hardware shop, or a quick-service café. Each vertical has its own metrics, from case-break tracking to kitchen timing. Buying guides like a roundup of the best retail POS systems benchmark reporting features across retail-focused platforms.
7. Purpose-Built Platforms for Your Vertical
Generalist POS tools cover the basics across industries, but they rarely go deep into any one. A dedicated retail POS system handles matrix inventory, vendor POs, and shrinkage reports the way retailers need them. Attractions and venues, by contrast, need reporting tied to guest spend, season passes, and theme park marketing campaigns.
8. Customer Support When Reports Break
Reports only help if you can trust them, and at some point, a number will look off. When that happens, you need a support team that actually picks up the phone. KORONA’s piece on the quality of customer support in POS software explains why 24/7 human support, not a chatbot, sets usable reporting platforms apart from frustrating ones when something goes wrong.
Frequently Asked Questions
When evaluating a store reporting solution, four questions cut through the noise: Can the data drive action? Will it move the business forward? Does it give you one reliable view? And will it work with your current and future stack?
1. Are the reports actionable and flexible?
Look for drill-down capabilities that let you filter by SKU, size, color, or style. The system should let you build custom reports so you can slice data the way your business actually operates, not just the way the vendor designed it.
2. What direct impact will this have on business performance?
A good solution flags out-of-stock risks on top sellers and surfaces slow-moving inventory before it needs a markdown. The real value is in automated, timely insights pushed to the right people so decisions get made faster and with less guesswork.
3. Can I access a single source of truth in real time?
The system should pull data from all your channels, including eCommerce, physical stores, and CRM, into one view. Cloud access is non-negotiable: you need live data on demand, not exports you have to wait for or manually refresh.
4. How well does it integrate with existing and future tools?
It should connect out of the box with your POS, accounting software, and major platforms like Shopify or Amazon. Just as important, confirm it scales as you grow, whether that means new locations, new channels, or tools you haven’t adopted yet.