A retail store performance dashboard leverages POS data to give you instant insights into your store’s key metrics—tracking daily foot traffic, sales conversions, customer behavior, and so much more—all in one place.
This post will discuss the top seven reports you can generate, as well as the 34 most useful metrics to track in your performance dashboard. We will also explore how an all-in-one POS system, such as KORONA POS, can help you run these reports effectively.
Key Takeaways:
- A store performance dashboard lets retail store owners track and analyze key performance indicators (KPIs) in real time.
- The dashboard combines data from point-of-sale systems, inventory management software, and customer relationship management tools to make data-driven decisions.
- KORONA POS offers a powerful store performance dashboard, providing real-time insights into sales, inventory, customer behavior, and employee productivity.
What is a Store Performance Dashboard for a Retail Store?
A store performance dashboard is a tool for monitoring and analyzing a retail store’s performance. It provides a real-time snapshot of the store’s key performance indicators (KPIs) in an easy-to-read and interactive format.
Store performance dashboards typically rely on data from multiple sources, including point-of-sale systems, inventory management software, and customer relationship management tools. By consolidating this data into a single dashboard, retailers get a comprehensive overview of their store’s performance.
7 Reports (+34 Metrics) That Matter in Your Retail Store Performance Dashboard
Here are seven important reports and 34 key metrics to include in your store performance dashboard. These tools will help you easily track your store’s success and make informed decisions for improvement.
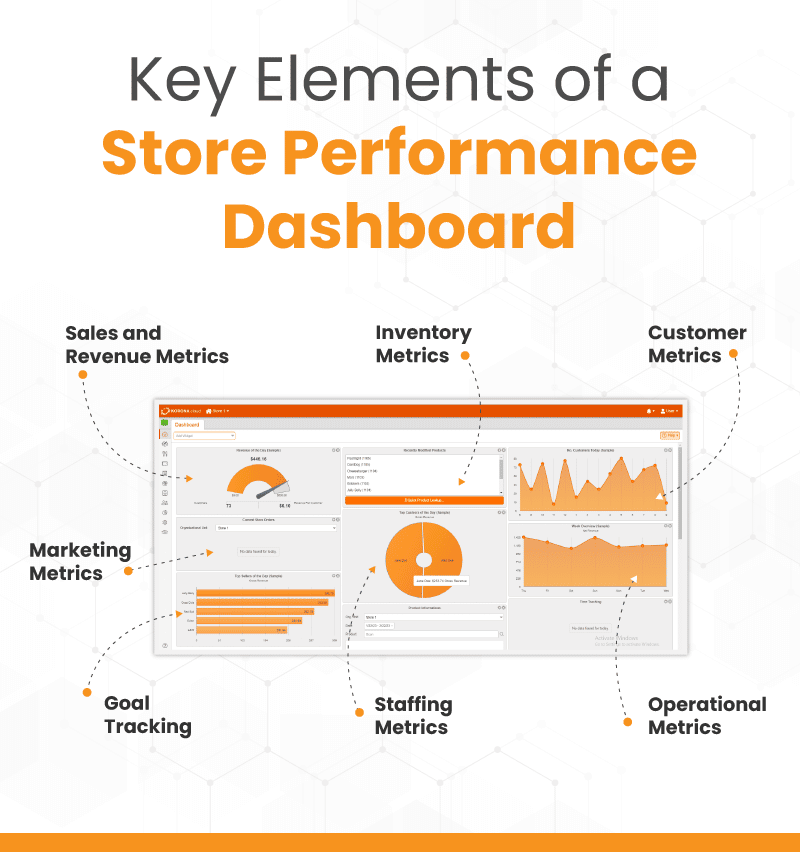
Sales and revenue metrics
This element of the dashboard highlights sales and revenue performance, including total sales, sales by category, average transaction value, gross margin, and revenue growth over time. These metrics help retailers to identify top-performing products and areas for improvement.
Let’s break down some of these store’s financial performance:
1. Total sales: These are the gross sales value over a specific period. This metric provides a high-level overview of revenue generation.
2. Net sales: This metric highlights gross sales minus returns, allowances, and discounts. They offer a more accurate picture of revenue.
3. Sales by product/category: Helps identify bestsellers and underperformers, aiding in inventory and marketing decisions.
4. Average transaction value (ATV): Total sales divided by the number of transactions. This metric helps understand the average spending per customer.
5. Sales per square foot: Total sales divided by the sales floor area. It’s a key performance indicator of space utilization.
6. Year-over-Year (YoY) Growth: This is a comparison of sales figures from the current period to the same period last year, indicating growth trends.
Inventory metrics
Inventory metrics help retailers track stock levels, identify stock shortages, and manage inventory replenishment. You’ll need solid inventory management software to access these metrics. The metrics under this umbrella include:
7. Inventory turnover rate: The cost of goods sold divided by average inventory measures how quickly inventory is sold and replaced.
8. Days sales of inventory (DSI): This metric indicates the average number of days inventory is held before being sold.
9. Stock-to-sales ratio: Average inventory divided by sales. It helps manage inventory levels to avoid overstocking or stockouts.
10. Shrinkage: The difference between recorded inventory and actual inventory, often due to theft, damage, or errors.
11. Gross margin return on investment (GMROI): Gross profit divided by average inventory cost. It measures the profitability of inventory.

Learn how to manage your inventory effectively with this free eGuide.
Customer metrics
Customer metrics are essential for understanding customer behavior, preferences, and loyalty. The customer metric store performance dashboard element should include metrics such as customer satisfaction scores, retention rates, lifetime value, and more.
12. Customer count: The total number of customers visiting the store within a given period.
13. Customer acquisition cost (CAC) is the total marketing and sales expenses divided by the number of new customers acquired. It helps gauge the efficiency of customer acquisition efforts.
14. Customer retention rate: The percentage of returning customers over a specific period. High retention indicates customer satisfaction and loyalty.
15. Customer lifetime value (CLV): The total revenue a business expects from a customer over their relationship. It helps in understanding the long-term value of customers.
Marketing metrics
Marketing metrics help retailers to measure the effectiveness of their marketing campaigns and promotions. This dashboard element should include metrics such as conversion rates, customer acquisition costs, and return on advertising spend (ROAS).
16. Return on marketing investment (ROMI) is the revenue generated from marketing campaigns divided by the marketing cost. It evaluates the effectiveness of marketing efforts.
17. Conversion rate: The percentage of visitors who make a purchase. It indicates the effectiveness of marketing and sales strategies.
18. Cost per lead (CPL) is the total marketing spend divided by the number of leads generated. It helps assess the cost efficiency of marketing campaigns.
19. Traffic sources: The origin of store visitors, such as organic search, social media, email campaigns, or referrals. This helps allocate marketing resources effectively.
20. Promotional performance is the sales and revenue generated from specific promotions or discounts, which helps assess the success of marketing campaigns.
Staffing metrics
Staffing metrics help retailers manage labor costs and ensure that they have the right number of staff members at any given time. This dashboard element should include metrics such as:
21. Sales per employee: Total sales divided by the number of employees. This metric helps measure employee productivity.
22. Labor cost percentage: Total labor cost divided by total sales. This percentage helps manage payroll expenses relative to revenue.
23. Employee turnover rate: The percentage of employees who leave the company within a specific period. High turnover can indicate issues with employee satisfaction or management.
24. Average hourly rate: Total payroll expenses divided by total hours worked. It provides insights into labor cost management.
25. Employee scheduling: This metric measures the alignment of staffing levels with peak and off-peak hours to optimize labor costs and customer service. Having the best employee scheduling software for your retail store will be crucial to have this metric.
Operational metrics
Operational metrics help retailers monitor store performance and identify areas for improvement. This dashboard element should include metrics such as store traffic, return rates, and checkout times.
26. Order fulfillment time: This is the average time taken to process and deliver an order. It impacts customer satisfaction and operational efficiency.
27. Return rate: The percentage of sold products that are returned. It helps identify issues with product quality, customer expectations, or delivery processes.
28. Operating expenses are the total costs of running the business, excluding the cost of goods sold. Tracking these helps manage profitability.
29. Compliance and safety: This metric tracks adherence to industry regulations. The compliance and safety metrics can be important for liquor stores, vape and tobacco shops, CBDs, and more.

This guide has tips to help you become the best manager you can be! Plus, free printable templates and checklists are included for use in your retail store operations.
Goal tracking
The dashboard should display the store’s goals for each KPI and the progress toward achieving those goals. This can help store managers and employees stay focused on achieving their targets.
30. KPI benchmarks: Setting and tracking Key Performance Indicators (KPIs) against industry benchmarks or internal targets to measure progress.
31. Monthly/quarterly objectives: Regularly setting and reviewing short-term goals to ensure the business stays on track.
32. Progress towards annual goals: Monitoring the achievement of annual objectives, such as revenue targets, market expansion, or new product launches.
33. Action plan performance: Tracking the implementation and effectiveness of strategic initiatives and action plans.
34. Budget Adherence: Monitoring actual expenses and revenues against the budget to ensure financial discipline and identify variances.
What Are the Benefits of Using a Store Performance Dashboard?
In today’s data-driven business environment, retail store performance dashboards have become a critical tool for retailers, both for brick-and-mortar and eCommerce businesses. Here are some of the benefits of using store performance dashboards:
#1: Real-time visibility
Retail store performance dashboards offer real-time visibility into store performance, so retailers can see how the business is doing at any given moment. This real-time data can help retailers make timely decisions to optimize their business.
#2: Improved decision-making
Store performance dashboards give retailers data-driven insights into customer behavior, sales trends, and inventory levels. This information helps retailers make informed decisions about everything from inventory management to marketing and sales strategies.
#3: Better inventory management
Retailers can use store performance dashboards to monitor inventory levels and stockouts and forecast demand for multiple locations in one place. This data helps retailers optimize inventory levels and reduce inventory holding costs.
#4: Improved customer experience
Store performance dashboards can provide valuable insights into customer preferences and buying patterns. This information also helps retailers optimize store layout, improve the customer experience, and increase customer satisfaction.
#5: Increased sales and profitability
Retailers can use store performance dashboards to identify sales trends and opportunities, as well as areas where costs can be reduced and profits increased. This will help retailers improve their bottom lines.
#6: Better staff management
The retail performance dashboards can help retailers monitor staff performance, including sales, attendance, and productivity. This data can help retailers identify training needs and optimize staffing levels.
#7: More effective marketing
Store performance dashboards can help retailers identify marketing trends and opportunities. This data can help retailers develop more effective marketing campaigns and promotions.
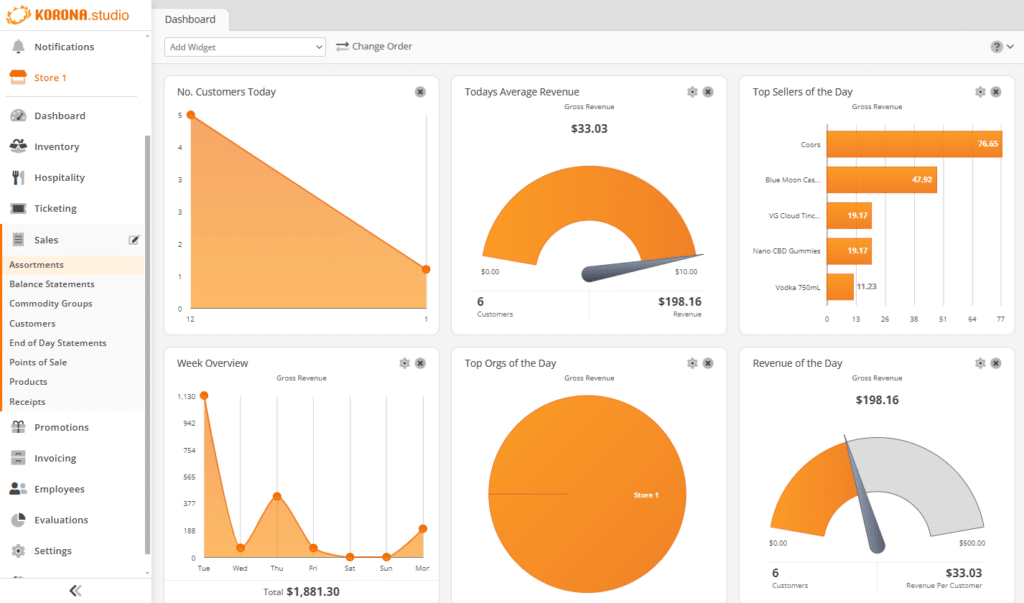
POS Analytics & Store Performance Dashboard Example: KORONA POS
KORONA POS is cloud-based point-of-sale software built for retailers of all sizes, from small shops to large chains. It features features like inventory, customer, and employee management, plus seamless integrations with accounting and eCommerce systems, and is designed to simplify your workflow.
The store performance dashboard sets KORONA POS apart, offering real-time insights into sales, inventory, customer behavior, and employee productivity. This powerful tool empowers retailers to make informed, data-driven decisions that boost operations and profitability.
Key benefits include:
- Real-time sales data: Track sales instantly to respond to trends and adjust on the fly.
- Inventory management: Stay updated on stock levels and receive alerts when products are running low.
- Customer insights: Personalize marketing by analyzing purchase history and preferences.
- Employee performance: Monitor productivity and track sales performance for better management.
An All-in-One Retail POS System Integrated With Your Store Performance Dashboard
KORONA POS offers a seamless, all-in-one solution that integrates your point of sale with a powerful store performance dashboard. This integration allows you to manage everything from sales to inventory while gaining real-time insights that help you optimize operations and drive profitability.
Ready to see how KORONA POS can transform your business? Dive deeper into the features or get started with a free demo to experience the power of data-driven decisions in action.
Get started with KORONA POS today!
Explore all the features that KORONA POS has to offer with an unlimited trial. There’s no commitment or credit card required.
FAQs: Retail Store Performance Dashboard
What is a store performance dashboard?
A store performance dashboard is a visual representation of key performance indicators (KPIs) for a retail store. It provides an overview of important metrics such as sales, inventory, and customer satisfaction. This dashboard allows store managers and executives to make informed decisions about improving store performance.
What KPIs should be included in a store performance dashboard?
The KPIs included in a store performance dashboard depend on the goals and objectives of the store. However, some commonly tracked metrics include sales revenue, gross margin, inventory turnover, customer traffic, and average transaction value. Other useful metrics may include customer satisfaction ratings, employee performance, and marketing campaign performance.
How often should a store performance dashboard be updated?
Store performance dashboards should be updated regularly, depending on the frequency of data collection and the business’s needs. Many stores update their dashboards daily or weekly to stay up to date on sales and inventory levels. However, some stores may only update their dashboards monthly or quarterly if their data is less time-sensitive.
What are the benefits of using a store performance dashboard?
A store performance dashboard offers several key benefits. It allows managers to easily access critical data for informed decisions on inventory, pricing, and marketing. It also identifies trends in sales and customer behavior, guiding future strategies, and highlights areas needing improvement, such as underperforming products or inefficient processes.
Can you build a retail store performance dashboard in Excel?
Yes, you can create a retail store performance dashboard in Excel, which is a good starting point for smaller businesses. By using pivot tables and charts, you can visualize key performance indicators (KPIs) like sales and inventory turnover, but consider more advanced tools for larger datasets and complex analysis.