Key Takeaways
- Measure Strategic Goals: KPIs are quantifiable metrics that track a retailer’s progress towards specific business objectives.
- Identify Trends & Issues: Tracking KPIs provides unbiased, real-time data to spot successful trends and quickly flag operational or financial trouble spots.
- Optimize Operations: Metrics like Inventory Turnover and Conversion Rate highlight efficiencies or bottlenecks in stock management, sales processes, and store layout.
- Enable Data-Driven Decisions: KPIs move decision-making away from guesswork, offering concrete information to inform strategies for pricing, staffing, and marketing investment.
The retail industry is one of the most competitive in the world. In order to grow your retail business, you must constantly analyze which factors could contribute to its success.
Key performance indicators (KPIs) are useful tools for doing just that. By staying up to date with trends around your niche market, keeping your teams aligned, and gaining realistic insight into the health of your operation, leveraging KPIs allows for a holistic approach to improving your retail business’s performance.
Hundreds of measurable KPIs exist, so where should you start? This article will detail the 20 most important KPIs for retailers to track. Leverage our suggested KPIs to ensure your retail business is healthy and headed in the right direction.
What Are KPIs?
A KPI is a measurable target that indicates how well a business is performing. Companies can identify their success and pain points by looking at several critical indicators, such as profits, sales numbers, and annual expenses, among many others.
Reviewing and evaluating KPIs helps businesses determine whether or not they are on track to meeting their objectives so they can make strategic changes where necessary.
Top Important Retail KPIs and Metrics to Track

Retailers should prioritize the following metrics and KPIs to effectively manage and optimize their business operations:
Sales Performance KPIs
Tracking sales performance is essential for a retailer to understand how will its products and promotions are performing. The following KPIs can help retailers gauge overall business health and identify trends or shifts in the customers’ purchasing behaviors:
The Year-Over-Year (YoY) Sales Growth KPI measures a business’s average yearly sales growth as a percentage. For retailers, YoY can be used to evaluate how sales performance during a certain period compares to the same period in the previous year. This comparison helps assess growth, identify trends, and make strategic business decisions.
Formula: (Sales in Current Year−Sales in Previous Year) / Sales in Previous Year × 100
How it’s useful: YoY comparisons are great for getting a big-picture idea of your business’s performance. Combine this metric with a few others to make it more revelatory of your business’s health.
example
This year, Cloud Nine Smoke Shop had sales of $120,000 last year and $150,000 this year. To calculate YoY sales growth, you must find the difference between the current year’s sales and the previous year’s sales. In this case, the difference is $150,000 minus $120,000, which equals $30,000.
Next, divide this difference by the sales amount from the previous year, which is $120,000. This gives you a growth ratio of $30,000 divided by $120,000, or 0.25. To express this ratio as a percentage, multiply it by 100, resulting in a YoY sales growth of 25%.
This percentage indicates that Cloud Nine Smoke Shop’s sales increased by 25% compared to the previous year.
For a tool that specifically quantifies sales performance over time, consider using a sales growth calculator.
The Sales Per Square Foot (SPSF) KPI measures the efficiency of a store’s space in generating revenue. It provides insight into how effectively a retailer utilizes its retail space to drive sales.
Formula: Sales Per Square Foot (SPSF)= Total Sales / Total Square Footage of Retail Space
How it’s useful: SPSF can indicate multiple aspects of store performance, including retail store layout and design, staff productivity, and multi-location analysis. Larger retailers also compare this measurement across different locations to identify any cultural or social differences that might impact sales.
example
Cloud Nine Smoke Shop has annual sales totaling $150,000 and occupies a space of 1,500 square feet. To calculate sales per square foot, divide the total sales by the total square footage.
In this case, you could divide $150,000 by 1,500 square feet, resulting in a sales figure of $100 per square foot. This KPI indicates that, on average, Cloud Nine Smoke Shop generates $100 in sales for every square foot of retail space.
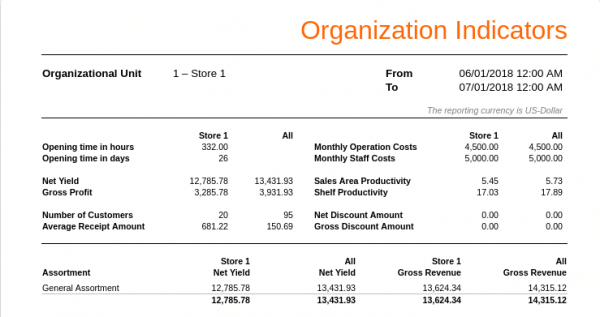
The image below shows how KORONA POS breaks down sales by total retail space.
The Average Transaction Value (ATV) KPI measures the average amount spent by a customer per transaction. ATV is a key metric for understanding consumer spending behavior and assessing the effectiveness of sales strategies and pricing.
Formula: Average Transaction Value (ATV)= Total Sales / Number of Transactions
How it’s useful: ATV helps retailers gauge sales performance by showing the average revenue per transaction. A higher ATV indicates effective upselling or product mix strategies, while a lower ATV might signal opportunities for improvement. Track your ATV to optimize pricing, promotions, and overall sales strategy for your retail business.
example
Cloud Nine Smoke Shop generated total sales of $150,000 over the year and processed 3,000 transactions during that period. Calculate the ATV by dividing the total sales by the number of transactions.
$150,000 in sales divided by 3,000 transactions results in an average transaction value of $50. This means that, on average, each customer spends $50 per purchase at Cloud Nine Smoke Shop.
The Break-Even Point (BEP) KPI measures the level of sales at which total revenues equal total costs, resulting in neither profit nor loss. BEP helps retailers understand how much they need to sell to cover costs before they start making a profit, which is critical for setting sales targets and budgets.
Formula: Break-Even Point = Fixed Costs / Selling Price per Unit − Variable Cost per Unit
How it’s useful: A successful retailer understands that the success of their business depends on more than just selling an item for more than it costs. They ensure they are making enough money to cover their expenses, too. The BEP KPI helps retailers understand their bottom line so their business is profitable from the start.
example
Cloud Nine Smoke Shop has fixed costs of $60,000 annually (including rent, salaries, and utilities). For the sake of this example, each product is sold at $30, and the variable cost per unit is $15.
To calculate BEP, first calculate the contribution margin by substracting the variable cost from the selling price: $30 – $15 = $15.
Next, divide the fixed costs by this contribution margin per unit: $60,000 / $15, which equals 4,000 units. This means Cloud Nine Smoke Shop needs to sell 4,000 units to cover all fixed costs and break even.
Customer Experience KPIs
When retailers exceed their customers’ expectations, they build customer loyalty and encourage repeat business. The following KPIs are vital for retailers to assess how well they’re managing their customer experience:
The Customer Satisfaction Score (CSAT) KPI measures customer satisfaction with products and services, typically through surveys. High CSAT scores indicate that customers are pleased with their experience.
Formula: CSAT Score = (Number of Satisfied Customers / Total Number of Respondents) x 100
How it’s useful: CSAT shows retailers how happy customers are with their shopping experience, and happy customers drive repeat purchases, foster brand loyalty, and generate positive word of mouth, all of which boost revenue and enhance a retailer’s reputation and market position.
example
Cloud Nine Smoke Shop surveyed 100 customers, and 80 rated their satisfaction as a 4 or 5 on a 5-point scale. To calculate the CSAT score, divide the number of satisfied customers by the total number of respondents and then multiply by 100.
In this case, the CSAT score would be calculated as (80/100) x 100, resulting in an 80% satisfaction rate amongst Cloud Nine Smoke Shop patrons.
The Product Return Rate KPI measures the percentage of products sold that are returned by customers. High return rates can point to issues with product quality, customer satisfaction, or fulfillment processes, while low return rates generally suggest that products meet or exceed customer expectations.
Formula: Product Return Rate = (Number of Returned Units / Total Number of Units Sold) x 100
How it’s useful: Measuring the rates of returned items is a straightforward way of evaluating customer satisfaction. It also may serve as a guide for a smarter return policy. If you have a product that may be bought, used once, and returned (we’ve all been there, right?), change the policy to lower return rates on the item and all similar products.
example
Cloud Nine Smoke Shop sold 1,000 items in January, and 50 of those items were returned. To calculate the Product Return Rate, divide the number of returned items by the total number of items sold over the month, then multiply by 100 to get a percentage.
In this case, the calculation would be (50 returns / 1,000 sold items) x 100, resulting in a 5% return rate for Cloud Nine Smoke Shop in January.
The Customer Retention Rate (CRR) KPI tracks the percentage of repeat customers over a specific period. High retention rates indicate customer satisfaction and loyalty, which are crucial for a retailer’s long-term business success.
Formula: Customer Retention Rate = ((Number of Customers at End of Period – Number of New Customers Acquired During Period) / Number of Customers at Start of Period) x 100
How it’s useful: CRR allows you to see how much repeat business you’re getting and how well you retain customers. If you have a loyalty program in place, CRR is also a great indicator of how well it’s working.
example
Cloud Nine Smoke Shop had 500 customers at the start of the year. By the end of the year, the total number of customers had increased to 600. During this period, the shop had acquired 200 new customers.
To calculate retention rate, we first determine the number of retained customers by subtracting the new customers from the end-of-year total: 600 (end of year) – 200 (new customers) = 400 retained customers.
Next, we divide the number of retained customers by the number of customers at the start of the year: 400 / 500 = 0.80
Finally, we multiply by 100 to convert this ratio into a percentage: 0.80 x 100 = 80%. The customer retention rate for the smoke shop over the year is 80%, indicating that 80% of the customers from the beginning of the year were retained by the end.
The Average Response Time KPI measures the average time taken to respond to customer inquiries or complaints. This metric is crucial for evaluating customer service efficiency and effectiveness.
Formula: Average Response Time = Total Response Time / Number of Inquiries
How it’s useful: In a world of automated customer service lines and 45-minute hold times, a short average response time as a retailer is precious. It means customers get quick answers and support, walking away satisfied. Understanding and optimizing your average response time makes customers more likely to return (and recommend your store to future customers).
example
If Cloud Nine Smoke Shop received 100 customer inquiries over the past month and the total response time for all inquiries was 1,200 minutes, you would calculate the average response time by dividing the total response time by the number of inquiries.
In this case, the calculation would be 1,200 minutes divided by 100 inquiries, resulting in an average response time of 12 minutes. This means that, on average, it takes 12 minutes for Cloud Nine Smoke Shop to respond to a customer’s inquiry.
Inventory Management KPIs
Effective inventory management requires the delicate balance of maintaining optimal stock levels to meet customer demand without overstocking or stockouts. The following KPIs help retailers balance and optimize inventory management to maximize profit, operational efficiency, and customer satisfaction:
The Inventory Turnover Ratio KPI indicates how often inventory is sold and replaced within a period. This helps retailers measure how efficiently their inventory is being managed, which contributes to overall business performance.
Formula: Inventory Turnover Ratio = Costs of Goods Sold (COGS) / Average Inventory
How it’s useful: This metric is most useful for identifying ideal par levels on your inventory. Being short-stocked and over-stocked are equally damaging to most businesses, so getting it right is critical. Use KORONA’s Inventory Turnover Ratio Calculator to calculate your own.
example
Cloud Nine Smoke Shop has an average inventory of $30,000 and generates annual sales of $150,000. To calculate the inventory turnover ratio, divide the total annual sales by the average inventory.
In this case, the calculation would be $150,000 divided by $30,000, resulting in an inventory turnover ratio of 5. This means that Cloud Nine Smoke Shop’s inventory turns over 5 times per year.
The Sell-Through Rate (STR) KPI measures the percentage of inventory sold over a specific period relative to the amount of inventory available at the beginning of that period. It’s important to accurately calculate the sell-through rate. This metric also helps retailers understand how quickly and how well products are selling to manage inventory more effectively.
Formula: Sell-Through Rate = (Units Sold / Units Available For Sale) x 100
How it’s useful: STR is key for seasonal ordering and marketing. It’s important to order accurately throughout the year, and fluctuating sales by period make this difficult. So, like most KPIs, it’s helpful to have a substantial history for purposes of comparison.
example
Cloud Nine Smoke Shop had 500 units of lighters in stock at the beginning of the month and sold 350 lighters by the end of the month. To calculate the sell-through rate, divide the number of lighters sold by the total number of lighters available, then multiply by 100 to get a percentage.
In this case, the calculation would be (350 lighters sold / 500 total lighters) x 100, resulting in a 70% sell-through rate. This means that 70% of the inventory for lighters was sold during the month.
The Costs of Goods Sold (COGS) KPI measures the total cost incurred by a retailer to produce or purchase the goods that were sold during a specific period. COGS is critical for understanding profitability and streamlining inventory management.
Formula: Costs of Goods Sold = Beginning Inventory + Purchases – Ending Inventory
How it’s useful: COGS directly affects profitability. By understanding COGS, retailers can better manage pricing, control expenses, and set sales strategies that matter. Keeping COGS in check helps ensure healthy profit margins and financial stability, which is key for informed decision-making and retail business growth.
Example
Cloud Nine Smoke Shop started the year with an inventory valued at $20,000, made additional purchased totaling $100,000, and ended the year with $15,000 in inventory.
Calculate the COGS as follows: $20,000 (beginning inventory) + $100,000 (purchases) – $15,000 (ending inventory).
This results in a COGS of $105,000 for the year at the smoke shop.
The gross margin return on investment (GMROI) evaluates the profitability of inventory relative to its cost. It helps retailers assess how effectively their inventory investments are generating gross margin profits.
Formula: Gross Margin Return on Investment = Gross Margin / Average Inventory Costs
How it’s useful: There are industry standards for GMROI, so this is a simple and tangible way of hitting benchmarks. Look up what an optimal GMROI is for your retail niche and let it optimize your inventory and ordering.
example
Cloud Nine Smoke Shop’s gross margin is $90,000, and the average cost of inventory held over the period is $30,000. The GMROI would be calculated as $90,000 divided by $30,000, resulting in a GMROI of 3.
This means that for every dollar invested in inventory, Cloud Nine Smoke Shop earns $3 in gross profit.
Operational Efficiency KPIs
Operational efficiency metrics help retailers streamline processes while reducing costs. The following KPIs give retailers insights into workforce management, customer service efficiency, and the whole range of operations to streamline success:
The Labor Cost Percentage KPI measures the proportion of total sales revenue that is spent on labor costs. This metric helps retailers assess the efficiency of their workforce and manage operational expenses.
Formula: Labor Cost Percentage = (Total Labor Costs / Total Sales Revenue) x 100
How it’s useful: Measuring your Labor Cost Percentage helps you monitor and control your labor expenses so that they align with your budget targets and profitability goals. Build your staff as is appropriate for your sales volume, and channel your labor force in the most effective way for your business.
example
If Cloud Nine Smoke Shop’s annual sales amount to $150,000 and the total labor costs, including wages and benefits, are $30,000, you would calculate the Labor Cost Percentage by dividing the labor costs by the total sales revenue then multiplying by 100 for a percentage.
In this case, the calculation would be ($30,000/$150,000) x 100, resulting in a Labor Cost Percentage of 20%. This means that 20% of Cloud Nine’s sales revenue is allocated to labor costs.
The Checkout Time KPI measures the amount of time it takes for a customer to complete their purchase at the checkout counter. This metric is crucial for understanding the efficiency of the checkout process and its impact on customer satisfaction.
Formula: Average Checkout Time = Total Checkout Time / Number of Transactions
Why it’s useful: After a long day at work, the last thing you want to do is wait in a long checkout line at the grocery store. Optimizing your business’s checkout time directly impacts customer satisfaction (and your store’s efficiency). Using this KPI can lead to higher customer satisfaction and retention, and thats how successful businesses stay successful.
example
Cloud Nine tracks 100 transactions over a week, and the total checkout time for all these transactions is 1,500 minutes. To calculate average checkout time, divide the total checkout time by the number of transactions.
In this case, the calculation would be 1,500 minutes divided by 100 transactions, resulting in an average checkout time of 15 minutes. This means that, on average, it takes 15 minutes for each customer to complete their transaction.
The Shrinkage Rate KPI measures inventory loss due to theft, damage, or other factors that prevent the sale of goods. It is crucial for understanding and managing inventory losses and for accurate financial reporting.
Formula: Shrinkage Rate = (Shrinkage Value / Total Inventory Value) x 100
How it’s useful: Effective shrinkage management directly impacts your business’s bottom line and operational efficiency. By leveraging the shrinkage rate KPI, your business can reduce losses, improve inventory management, and enhance overall profitability.
example
Cloud Nine Smoke Shop starts the year with an inventory valued at $100,000, makes purchases amounting to $50,000, and ends the year with an inventory valued at $120,000.
The shrinkage rate can be calculated by first determining the total inventory value, which is $100,000 + $50,000 = $150,000. If the total inventory value implies a shrinkage loss of $30,000 ($150,000 – $120,000), you would then calculate the shrinkage rate by dividing the shrinkage loss by the total inventory value and multiplying by 100.
In this case, the shrinkage rate would be ($30,000/$150,000) x 100, resulting in a 20% shrinkage rate. This means that 20% of Cloud Nine Smoke Shop’s inventory value was lost.
The Order Fulfillment Time KPI measures the time taken to complete and deliver a customer’s order from the moment it is placed until it is fulfilled. This metric is essential for evaluating the efficiency of a retailer’s order processing and delivery systems and its impact on customer satisfaction.
Formula: Order Fulfillment Time = Total Fulfillment Time / Number of Orders
How it’s useful: In the e-commerce space, orders are being processed and fulfilled faster than ever. It’s critical that your business keeps up with this unprecedented pace. Optimize your order fulfillment time to directly impact customer satisfaction and loyalty.
example
Cloud Nine Smoke Shop processed 200 orders in June, and the total time taken to fulfill these orders was 1,000 hours. To calculate the average fulfillment time, divide the total fulfillment time by the number of orders.
In this case, the calculation would be 1,000 hours divided by 200 orders, resulting in an average fulfillment time of 5 hours. This means that, on average, it takes 5 hours for Cloud Nine Smoke Shop to complete and deliver an order.
Financial Health KPIs
Tracking financial health metrics is essential for evaluating a retailer’s profitability and financial stability. Leverage the following KPIs to measure your retail business’s financial health and make informed decisions about investments, expansions, and other strategic initiatives:
The Gross Profit Margin KPI indicates the percentage of revenue remaining after deducting the cost of goods sold. It measures how efficiently a retailer is producing and selling its goods relative to its costs.
Formula: Gross Profit Margin = (Gross Profit / Total Sales Revenue) x 100
How it’s useful: Gross Profit Margin is one of the most important yet simplest measures of a business’s efficiency. It’s a window into your company’s financial health and can help you set the selling price of your products. Higher margins indicate better control over production costs and pricing, and Gross Profit Margin KPIs get you there.
example
Cloud Nine Smoke Shop generates $150,000 in sales revenue and the COGS amounts to $105,000. You would first calculate the gross profit by subtracting COGS from sales revenue: $150,000 – $105,000 = $45,000.
Then, to find the Gross Profit Margin, divide the gross profit by the sales revenue and multiply by 100: ($45,000/$150,000) x 100, resulting in a GPM of 30%. This means that 30% of Cloud Nine’s sales revenue is gross profit.
The Net Profit Margin KPI measures the percentage of revenue remaining after all expenses have been deducted from total sales. It provides a comprehensive view of a retailer’s overall profitability, considering not just the cost of goods sold (COGS) but also operating expenses, taxes, and interest.
Formula: Net Profit Margin = (Net Profit / Total Sales Revenue) x 100
How it’s useful: Unlike Gross Profit Margin, which focuses solely on production costs, Net Profit Margin accounts for all operational costs, providing an even more comprehensive view of your retail business’s profitability. Use this KPI to guide your strategic decision-making and performance evaluations.
example
Cloud Nine Smoke Shop has a total sales revenue of $150,000 and a net profit of $30,000 after accounting for all expenses. Calculate the Net Profit Margin by dividing the net profit by the total sales revenue and multiplying by 100: ($30,000/$150,000) x 100, resulting in a Net Profit Margin of 20%.
This indicates that 20% of Cloud Nine’s sales revenue is retained as profit after all costs.
The Current Ratio KPI measures a retailer’s liquidity and short-term financial health. It measures the ability of a retailer to cover its short-term obligations with its short-term assets.
Formula: Current Ratio = Current Assets / Current Liabilities
How it’s useful: A healthy Current Ratio means a retailer can easily handle bills and unexpected costs—it’s like having enough cash to cover your monthly expenses. This is the bare minimum of what a business should track to protect its financial health.
example
Cloud Nine Smoke Shop has $40,000 in current assets (such as cash, inventory, and receivables) and $20,000 in current liabilities (such as accounts payable and short-term debt). To calculate the Current Ratio, divide current assets by current liabilities.
In this case, the calculation would be $40,000 in current assets / $20,000 in current liabilities = 2.0. This means that for every dollar of short-term liability, Cloud Nine Smoke Shop has two dollars in assets.
The Return on Assets (ROA) KPI evaluates how efficiently a retailer is using its assets to generate profit. ROA provides insight into the efficiency of asset utilization and overall financial performance.
Formula: Return on Assets = (Net Income / Total Assets) x 100
How it’s useful: ROA shows you how well your business is using its assets to make money. A higher ROA means your retailer is efficient in turning assets into profit, which helps evaluate if investments in things like stores and equipment are paying off.
example
If Cloud Nine Smoke Shop has total assets valued at $100,000 and generates a net profit of $15,000 over a specific period, you would calculate ROA by dividing the net profit by the total assets and then multiplying by 100.
In this case, the calculation would be ($15,000 net profit / $100,000 total assets) x 100 = 15% ROA. This indicates that Cloud Nine is earning 15 cents of profit for every dollar of assets it employs.
Marketing & Promotion KPIs
Here are four essential Key Performance Indicators (KPIs) for evaluating the success of retail marketing promotions:
Customer Acquisition Cost (CAC)
CAC calculates the total marketing spend required to acquire one new customer during the promotion. It is the promotional investment divided by the number of new customers. A lower CAC means the promotion is a cost-effective strategy for expanding the customer base.
Return on Promotion Investment (ROPI)
Calculates the profit generated from a promotion relative to its total cost. It helps assess the financial efficiency of campaigns by comparing incremental revenue against marketing spend. A strong ROPI confirms that promotions are profitable, whereas a weak ROPI highlights the need to optimize discount levels or targeting.
Incremental Sales Lift
Tracks the additional sales generated directly from a promotion compared to baseline performance. This KPI isolates the true impact of marketing activities by removing sales that would have occurred anyway. Retailers use it to determine if a promotion genuinely drives growth or merely shifts existing demand.
Conversion Rate (CR)
The Conversion Rate is the percentage of store visitors (or website visitors) who complete a purchase during the promotion. A successful CR indicates the promotion’s appeal, product placement, and overall in-store or online experience effectively converted traffic into actual sales.
How to Improve KPIs in Retail?
To improve KPIs in retail, focus on data-driven decision-making and operational efficiency. Use a robust inventory management system to track stock levels, prevent overstocking or stockouts, and ensure product availability.
Implement an advanced point of sale system to capture real-time sales data, customer preferences, and transaction trends.
Analyze these insights to optimize pricing, promotions, and staffing. Regularly review KPIs, set measurable goals, and adjust strategies quickly based on performance data.
WE CAN HELP
If you’re a retailer seeking a powerful Point-of-Sale (POS) system coupled with robust Inventory Management software, explore KORONA POS. It’s the ideal choice for high-risk retail like vape, smoke, CBD, convenience, and liquor stores, as well as QSRs and specialty shops. A major advantage is that KORONA POS is processing-agnostic, integrating seamlessly with any credit card processing company. Plus, it offers dual pricing capabilities. Click here to learn how KORONA POS can streamline your business and boost your KPIs today!
Why Are Retail KPIs Important?
As a retailer, much of your time and energy is spent managing your inventory, streamlining your logistics, and curating the customer experience. To determine whether your efforts are contributing to your business’s success, it’s crucial to track specific metrics across your online and in-store sales, as well as general operations, over time. Here’s why KPIs are critical measurement tools for retailers:
Performance Measurement
KPIs provide a straightforward and precise way to measure the effectiveness of your retail operation’s full spectrum, from sales performance to inventory management. By tracking KPIs, retailers can identify their areas of strength and weakness and make data-driven decisions to improve overall performance.
Goal Setting and Accountability
KPIs help retailers set specific, measurable goals and track progress toward them. For example, if a retailer wants to increase their customer satisfaction score, it can leverage particular KPIs related to customer feedback and service quality. These hyper-specific KPIs can provide benchmarks for success and hold teams accountable for achieving their growth targets.
Strategic Decision-Making
KPIs offer valuable insights into consumer behavior and market trends and can inform a retailer’s strategic decisions. Retailers can use KPIs to identify trends and patterns, assess market opportunities, and measure the impact of their strategic initiatives to make data-informed decisions that contribute to their business’s growth.
Automate KPI Tracking and Reporting For Your Retail Store with KORONA POS
Advanced retail point of sale software like KORONA POS helps retailers analyze important data, like retail KPIs and many others. Through customer databases, detailed inventory tracking, smart reporting and much more, your point of sale solution can be the hub of all business operations. Click below to find out more about KORONA.