
💡 Key Takeaways:
- 🧮 Balance Supply & Demand – Ensure enough stock to meet customer needs without overstocking.
- 📊 Data-Driven Decisions – Use historical sales, trends, and forecasts to guide planning.
- 📦 Optimize Stock Levels – Maintain the right amount of inventory to minimize holding costs.
- ⏱ Plan for Lead Times – Account for supplier and delivery times to avoid stockouts.
- 🔁 Continuous Monitoring – Regularly review and adjust plans to respond to market changes.
- 💻 Leverage Technology: Use inventory management software for real-time tracking and insights.
Good inventory planning helps reduce costs, avoid losses, save time, and streamline your business’s supply chain. It allows you to meet your customers’ expectations and consistently increase your revenue.
In this article, you’ll learn about the ins and outs of inventory planning and the challenges that come with managing inventory efficiently, and how to overcome them. We’ll also walk you through the most effective inventory management technologies and planning methods you need to know to keep your business humming.
What Is Inventory Planning?

Inventory planning is the strategic process of determining the optimal quantity and timing to meet customer demand while minimizing costs and maximizing efficiency.
It involves forecasting demand, setting reorder points, selecting appropriate inventory models (e.g., EOQ, Perpetual, JIT), and leveraging technology to maintain balanced stock levels for raw materials, work-in-progress, and finished goods.
Tailored to small retail businesses, effective inventory planning ensures product availability, minimizes internal costs, and adapts to market trends, ultimately supporting profitability and customer satisfaction.

Learn how to manage your inventory effectively with this free eGuide.
Benefits of Inventory Planning
The costs associated with poor inventory planning will certainly impact a company’s bottom line. Retailers miss out on nearly $1 trillion in annual sales because they don’t have what customers want to buy in their stores.
Roughly 20% of all out-of-stocks go unresolved for more than three days. This can result in significant revenue losses for retailers and other product-based businesses. Other benefits of effective inventory planning include the following:
More transparency
Inventory planning gives a company better control over stored and sold products, thereby significantly reducing the risk of employee theft and other inventory loss issues. Accurate inventory planning and tracking procedures also improve warehouse transparency and pinpoint staff members’ responsibilities.
Ensures better cash flow
The cost of holding and storing inventory is staggering for retail owners. It can make up about 20-30% of total inventory expenses. Better inventory planning helps you manage your inventory budget more wisely.
For example, when you order the optimal quantity of a product to meet future customer needs, you avoid excess inventory, which prevents tying up too much capital in inventory. Finally, inventory planning makes inventory accounting easier during tax season and simplifies accurate inventory reporting.
Higher profits
Inventory planning can help a company increase its profitability. The cost of producing and purchasing inventory significantly impacts gross profit.
Proper inventory planning will increase a company’s gross profits. It will also prevent businesses from wasting capital on ordering, storing, and managing excess inventory.
It will reduce associated expenditures such as labor wages, warehouse rent, transportation costs, and security expenses, resulting in a higher profit margin and more consistent revenues.
Improved customer satisfaction
Unexpected product shortages can undermine your business’s reputation and erode consumer loyalty. Whether it’s a physical store or an eCommerce business, a lack of consistently popular items can result in lost sales due to missed opportunities and disappointed consumers who are more likely to switch to competing brands.
Improved supplier relationships
With accurate inventory planning, businesses can provide suppliers with consistent and predictable order schedules, fostering stronger relationships. It can lead to better negotiation terms, discounts, or priority treatment. For example, a restaurant chain that plans its inventory effectively can maintain steady orders with food suppliers, potentially securing bulk discounts or faster delivery times.
Minimized inventory costs
Inventory planning optimizes stock levels to reduce excess inventory costs, such as storage, insurance, and spoilage. It also minimizes obsolescence risks for perishable or trendy items. Reducing inventory levels to what’s necessary cuts down on these costs significantly.
Compliance and Risk Mitigation
Effective inventory planning reduces waste by minimizing overstocking, spoilage, and obsolescence, contributing to more sustainable operations. For instance, a convenience chain that optimizes inventory for perishable goods like produce can significantly reduce food waste, aligning with environmental goals and potentially enhancing brand reputation among eco-conscious consumers.
Inventory Planning Process & Best Practices (Step-by-Step)
Effective inventory planning ensures your small retail business maintains optimal stock levels, minimizes costs, and meets customer demand. Below is a step-by-step guide to the inventory planning process, tailored for small retail owners, with best practices to maximize efficiency.
Step 1: Assess Current Inventory
Conduct a physical inventory count (raw materials, work-in-progress, finished goods) to establish a baseline. Knowing precisely what you have prevents overstocking or stockouts and informs future planning.
Best Practices:
- Use a simple spreadsheet or affordable inventory software for tracking.
- Categorize items by type, value, or sales frequency to identify slow-moving or high-demand products.
- Perform counts during off-hours to avoid disrupting sales.
Step 2: Analyze Historical Sales Data
Review past sales records (e.g., the last 6-12 months) to identify trends, seasonal peaks, and top-selling items. Historical retail sales analytics data drives accurate demand forecasting, which is critical for small businesses with limited budgets.
Best Practices:
- Use POS system reports or sales logs to track patterns (e.g., holiday spikes for gift shops).
- Apply ABC analysis: To prioritize management, categorize items as A (high-value, 20% of items, 80% of revenue), B (medium), or C (low).
- Account for external factors like local events or economic shifts affecting demand.
Step 3: Forecast Demand
Predict future sales using historical data, market trends, and upcoming events (e.g., holidays, promotions). Accurate forecasts prevent over-ordering or understocking, saving money and keeping customers happy.
Best Practices:
- Use simple forecasting methods like moving averages (e.g., average sales over 3 months) for small datasets.
- Adjust for seasonality (e.g., higher demand for winter clothing) and local trends (e.g., tourist seasons).
- Collaborate with suppliers or local business networks for market insights.
Step 4: Set Reorder Points and Safety Stock Levels
Determine when to reorder (reorder point) and how much extra stock (safety stock) to hold for unexpected demand. Reorder points ensure timely restocking, while safety stock protects against supply delays or demand spikes.
Best Practices:
- Calculate reorder point: (Average daily sales × lead time in days) + safety stock.
- Example: If you sell 10 shirts daily, supplier lead time is 5 days, and safety stock is 20 shirts, the reorder point is (10 × 5) + 20 = 70 shirts.
- Keep safety stock low (e.g., 10-20% of average demand) to minimize holding costs.
Step 5: Implement Inventory Management Tools
Adopt technology to track and manage inventory in real-time. Automation reduces manual errors and saves time, allowing focus on sales and customer service.
Best Practices:
- Use affordable tools like Square (free for basic POS) or Vend for small retailers.
- Set up automated alerts for low stock or reorder points.
- Integrate inventory software with your POS to sync sales and stock data.
Step 6: Monitor Inventory KPIs Regularly
Review inventory key performance indicators weekly or monthly to refine forecasts and processes. Ongoing monitoring keeps your inventory lean and responsive to changing demand.
Best Practices:
- Track key metrics: inventory turnover (COGS ÷ average inventory), stockout rates, and holding costs.
- Conduct spot-checks or cycle counts (e.g., count A items weekly, C items monthly) to verify data.
- Adjust reorder points or safety stock based on new sales trends or supplier reliability.
Step 7: Train Staff and Document Processes
Ensure your team understands inventory procedures and uses tools correctly. A trained team ensures consistency and reduces costly mistakes in inventory management.
Best Practices:
- Create a simple guide for receiving, counting, and updating inventory.
- Train staff on POS and inventory software to minimize errors.
- Assign clear roles (e.g., who handles reordering or audits) to avoid confusion.
Inventory Planning Models And Strategies
Several inventory planning methods are available, each with its own advantages and disadvantages. Below are key models and strategies, including their pros, cons, and applications.
Economic order quantity (EOQ) Model
The economic order quantity is a formula used to determine the ideal amount of items a company should order to minimize inventory costs, such as holding costs, shortage costs, and ordering costs, and maximize business value in the replenishment and ordering.
The EOQ formula is particularly well suited to situations where demand, ordering, and carrying costs remain constant.
The EOQ model also allows you to determine the size of the production batch and the amount of work-in-progress that will be available for the next production step or delivery to the customer. It can also indicate how many orders will be booked in a year.
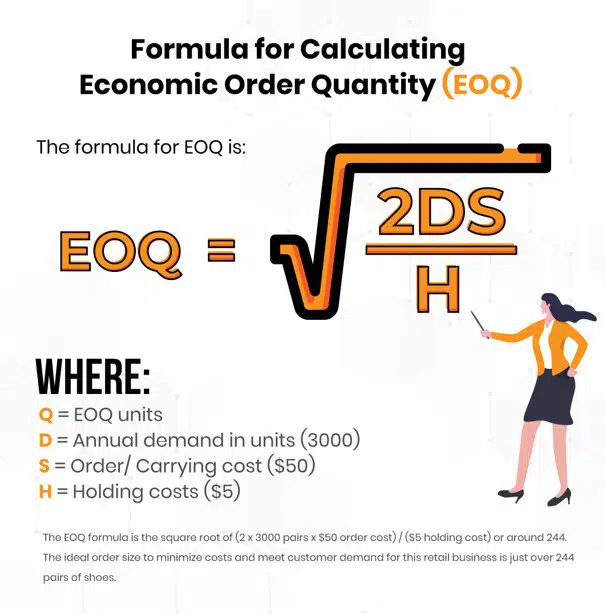
For example, let’s assume a retail shoe store sells women’s shoes. Each year, the store sells 3000 pairs of shoes, and it costs $5 per year to keep one pair in stock. The fixed cost for the company to place an order is $50. Here’s how to calculate the EOQ.
EOQ = square root of 2 X D X S divided by the carrying cost
Q=EOQ units
D= Annual demand in units (3000)
S=Order/ Carrying cost ($50)
H=Holding costs ($5)
The EOQ formula is the square root of (2 x 3000 pairs x $50 order cost) / ($5 holding cost) or around 110. The ideal order size to minimize costs and meet customer demand for this retail business is just over 244 pairs of shoes.
Pros of EOQ
- Businesses can take advantage of supplier discounts when they know how much stock they will need to cover the year’s requirements. Buying wholesale can significantly reduce purchasing costs.
- The economic order quantity reduces the cost of maintaining inventory with a specific recommendation for the annual order level.
Cons of EOQ
- It is based on the assumption that the demand for a product is constant without considering economic and seasonal fluctuations.
- EOQ requires constant monitoring of inventory levels.
Perpetual Inventory Model
The perpetual inventory model (also known as the continuous inventory system) is often used by companies dealing with partial or finished products. It continuously tracks inventory quantities, and replenishment orders are placed when the inventory reaches a certain threshold (the reorder point).
The continuous inventory model works most effectively with a computer database called a point of sale system.
However, a key point to bear in mind is that while the stock levels in a perpetual inventory system are updated in real-time, you will still need to double-check your numbers through an occasional manual audit. The perpetual inventory method rules out theft, missing, or damaged products, etc.
Perpetual Inventory System Pros
- It provides better replenishment decision-making with knowledge of your inventory levels – you’ll know when you’ve reached your reorder points.
- Employees can quickly check if a product is in stock – an essential piece of information for same-day orders.
- The centralized system makes it easy to track inventory across multiple locations.
Perpetual Inventory System Cons
- If the recorded inventory does not match the actual inventory levels, the entire system is compromised.
- Human errors can occur if you enter information incorrectly.
See the full list of differences in our full guide on perpetual inventory vs periodic inventory systems.
The Just-In-Time (JIT) Inventory Model
A just-in-time inventory system keeps inventory low by producing only specific customer orders. The direct impact of this method is a significant reduction in inventory investment and scrap costs, even though a high level of coordination is required.
The JIT inventory model differs from the common practice of switching to production or placing orders based on customer needs.
Just-In-Time Inventory Pros
The advantages of the just-in-time inventory method are as follows:
- Inventory should have low obsolescence, as a high inventory turnover rate prevents items from remaining in stock and becoming outdated.
- Easier to cease production of a particular type of product and switch to another product to meet changes in customer demand.
- Low holding costs due to very low inventory levels.
Just-in-time inventory cons
- A company may be unable to immediately fulfill the need or requirement of a large and unexpected order because it does not have enough inventory.
- If the supplier does not deliver the items on time and in the right quantities, a business can be out of stock for days. The direct impact would be a large loss of profit.
Periodic Inventory System
This physical counting method measures inventory levels and the cost of goods sold (COGS). Inventory levels and cost of goods sold are refreshed at the end of a specific period (monthly or annually). The inventory quantity to be ordered is established based on what is on-hand and the expected demand.
The following is the cost of sales calculation for a periodic inventory system
Initial inventory balance + cost of inventory purchased ending cost of inventory = COGS.
Pros of Periodic Inventory
- Suitable for small business models
- Can be performed without complicated preparation
- Set the schedule according to business needs
Cons of Periodic Inventory
- Less accurate than the perpetual system, since the period of counting levels is longer, instead of in real-time
- When multiple accounts track sales, orders, holding, etc., periodic counting can be complex
ABC Inventory Analysis
The ABC analysis categorizes inventory into A (high-value), B (medium-value), and C (low-value) items to prioritize management.
Pros of inventory analysis
- Focuses resources on high-value items for maximum impact.
- Simplifies inventory control by segmenting products.
Cons of inventory analysis
- Requires accurate data to classify items correctly.
- May overlook low-value items critical to operations.
Safety Stock Inventory
The safety stock inventory maintains extra inventory to buffer against demand variability or supply delays.
Pros of Safety Stock Inventory
- Prevents stockouts during unexpected demand spikes.
- Enhances customer satisfaction by ensuring product availability.
Cons of safety stock inventory
- Increases holding costs due to additional inventory.
- Requires accurate forecasting to avoid overstocking.
What Are The Challenges of Inventory Planning?
Inventory planning can become increasingly challenging when a retail business or organization has multiple channels with multiple warehouses.
Fluctuating demand and seasonality must also be considered. The main inventory planning challenge you will encounter is making sure your store has enough products in stock but not too many.
Inaccurate inventory tracking
Small businesses often start their inventory management with a manual tracking system. The small volume of inventory may make them think an automated system is unnecessary.
However, many owners don’t realize that manual inventory planning or the use of spreadsheets and paper are inefficient, time-consuming, and prone to human error. In addition, due to limited visibility in warehouses, identifying or locating your inventory can be challenging.
When you track inventory across multiple channels, you have sophisticated inventory management software to view the data. Knowing how much inventory you have on hand at any time of the year is necessary to keep budgets down and stay profitable.
The human factor
Technology is not the be-all and end-all, no matter if you use the best inventory management software. For companies with giant warehouses, inventory planning is controlled by an inventory planner. When this person is replaced by a new inventory planner, there is a lot of historical knowledge that must be passed on to the new person in charge.
The new planner will not initially have the internal knowledge of the outgoing planner and may have difficulty grasping the historical reasoning underlying the current inventory management system.
In addition, you need to make sure that your staff is appropriately trained to use the software. Poor staff training will negatively impact management and lead to calculation errors. In addition, poor communication between procurement, production, and quality control managers will ultimately affect your company’s performance.
Poor inventory control
Excess inventory is just as damaging as a lack of stock in your store. Overstocking increases not only the cost of storage but also the space. If you are performing inventory reporting for a convenience store, the likelihood is high that you sell perishable items such as food, making it even more important to control your inventory effectively.
Conversely, if your inventory levels are low, overselling and out-of-stock problems hurt customer satisfaction. Not knowing your exact inventory levels at any given time makes it difficult to plan how much inventory your business needs.
Facing fluctuations in demand
As a retailer, you must constantly deal with fluctuations in demand throughout the year. Increased customer orders are usually seen around the holidays, especially when you run promotions like Christmas marketing campaigns. Poor ordering strategies will impact your ability to meet these changing demands and even result in stock-outs.
With a demand forecasting tool, retailers can project inventory management software into the future. These functions integrate with your accounting and sales data to help you anticipate demand and place orders based on changing customer needs, seasonal fluctuations, or product availability.
KORONA POS Makes Inventory Planning Faster & Easier
The choice of your retail inventory management system is critical to the success of your business. KORONA POS has an inventory management software system specifically tailored to the needs of retail businesses. It is constantly updated with new features, integrated according to the needs and issues encountered by retail businesses.
Some of the features you can find with KORONA POS include:
- Inventory tracking and optimization
- Orders and invoicing
- Customer relationship management
- Reporting tools
- Shipment tracking
- Bar code
- Price lists
- Demand forecasting
KORONA POS inventory tracking software automatically detects and notifies you of any inventory issues and helps you prioritize products that are out of stock or selling less frequently.
In our rapidly changing retail ecosystem, you need to be armed with a system that can enhance your operational agility and allow you to quickly adapt to any sudden market changes, stay competitive, and retain your customers in changing and turbulent markets.
Schedule a KORONA POS Demo Today
Speak with a product specialist and learn how KORONA POS can power your business needs.
Frequently Asked Questions: Inventory Planning
What is and how is inventory planning done?
Inventory planning is the supply-and-demand prognosis used to determine how often and how much to order. When done well, inventory planning optimizes costs and ensures there is enough supply to meet consumer demand.
How do you calculate inventory planning?
Businesses can use different methods to calculate how much to keep in stock, such as inventory planning models and strategies such as the economic order quantity (EOQ) model, perpetual inventory model, just-in-time (JIT) model, or periodic inventory system.
What are the 4 main steps in inventory management?
The four main steps in inventory management are purchasing, storing, tracking, and reordering. Purchasing involves acquiring the right quantity of stock from suppliers based on demand forecasts. Storing refers to organizing and managing inventory in a secure, accessible location. Tracking includes monitoring stock levels, movements, and sales using manual logs or automated systems. Reordering ensures timely inventory replenishment to avoid stockouts or overstocking, often using inventory control methods like EOQ or just-in-time.