
Key Takeaways:
- C-store inventory is more complex than general retail due to high SKU counts, tight space, perishables, and regulated products
- Strong inventory performance depends on data-driven reordering, ABC analysis, cycle counts, and demand forecasting
- Shelf space, category management, and POS systems should work together to reduce stockouts, shrinkage, and waste
For a convenience store operating on thin margins with thousands of SKUs turning over daily, inventory management is a survival skill. In fact, between a quarter and a half of customers who experience a stockout won’t return to that store.
This guide covers everything you need to run tighter inventory: the unique challenges c-stores face, best practices that actually work on a busy floor, the KPIs worth tracking, demand forecasting, category management, and what to look for in a POS system when you’re ready to automate.
Why C-Store Inventory Is Uniquely Challenging
A lot of inventory management advice is written for general retail. Convenience stores are a different animal. Here’s why:
- Massive SKU counts in a tiny footprint. The average c-store carries 3,000–5,000 SKUs: cigarettes, motor oil, and grab-and-go sushi all crammed into maybe 2,500 square feet. Every inch of shelf space has to earn its keep.
- High velocity, low margin. Fast-moving consumer goods sell in hours or days. A forecasting error shows up almost immediately as a stockout or wasted product.
- Multiple product types with completely different rules. Packaged chips. Fresh sandwiches. Tobacco. Alcohol. Lottery tickets. Each category has its own spoilage timeline, compliance requirement, and shrinkage risk.
- Limited storage. Unlike supermarkets, most c-stores have minimal backroom space. There’s very little room to over-order.
- Lean staffing. The person managing inventory is often also running the register, stocking shelves, and making food, which means manual processes can break down quickly.
None of this is insurmountable, but it means that inventory strategies that work elsewhere need to be adapted to the c-store context.
The 5 Biggest Inventory Challenges in Convenience Stores
1. Stockouts on Fast-Moving Items
Why it happens: High-velocity items like energy drinks, bottled water, cigarettes, and popular snacks sell through faster than reorder cycles can keep up with, especially if you’re ordering manually or on a fixed schedule, regardless of actual sales pace.
The fix: Set automated reorder points based on real sales data rather than calendar dates. Your reorder point should factor in daily sales velocity and your supplier’s lead time. If a product sells 10 units a day and your supplier takes 3 days to deliver, your reorder point should be at least 30 units with a buffer on top.
PRO TIP!
Set separate reorder points for weekdays vs. weekends if your traffic patterns differ significantly. A Thursday reorder point and a Friday reorder point for the same SKU can be meaningfully different numbers.
2. Overstocking Slow Movers and Perishables
Why it happens: Bulk discounts are tempting. So is the fear of running out. But ordering more than you can sell, especially on perishables, can convert your “savings” directly into waste and cash tied up in unsellable product.
The fix: Use your sales history before accepting any bulk deal. If buying 100 cases of soda saves 10% but you can realistically only sell 60 before the promotional window closes, you’re not saving anything. For perishables, implement FIFO (First In, First Out) discipline at every stocking step.
PRO TIP!
FIFO only works if your staff actually practice it. Post a simple visual reminder at your cooler and receiving area. Just a quick “oldest stock in front” note with a diagram will do.
3. Shrinkage From Theft and Administrative Error
Why it happens: Shoplifting, employee theft, receiving errors, and data entry mistakes all show up the same way in your inventory: product you thought you had that isn’t actually there. Without regular counts, you won’t catch it until the discrepancy is large.
The fix: A two-part approach works best. Physical: security cameras at high-theft areas (candy, energy drinks, alcohol), anti-theft devices on high-value products. Systemic: role-based access in your POS so employees can’t adjust inventory without a manager, plus regular cycle counts.
4. Supplier Inconsistencies
Why it happens: Most c-stores rely on several suppliers across different categories. One delayed truck, one substituted product, or one short-filled order can leave gaps on your shelf immediately.
The fix: Maintain backup supplier relationships for your top 20 highest-velocity SKUs. Build a 1–2 day buffer into your reorder points for suppliers with inconsistent delivery records. Document delivery performance by vendor so you have data when it’s time to renegotiate.
5. Limited Backroom Storage
Why it happens: C-stores aren’t built for storage. Without a disciplined ordering strategy, the backroom overflows with slow-movers while the shelf is empty on the products that really matter.
The fix: Embrace just-in-time (JIT) ordering for your highest-velocity items (smaller, more frequent orders that match your sell-through rate). Keep backup inventory just for items where a stockout would clearly cost you money.
Best Practices for Managing Convenience Store Inventory
Strong convenience store inventory management is about controlling what matters most, before small inefficiencies become major margin losses. The following core practices help reduce stockouts, shrinkage, waste, and cash tied up in the wrong products.
Use ABC Analysis to Prioritize Your Attention
Not all products deserve equal attention. ABC analysis classifies your inventory into three tiers based on revenue contribution:
← Scroll to see more →
| Tier | What It Means | ~% of SKUs | ~% of Revenue | How to Treat It |
|---|---|---|---|---|
| A Items | Top sellers, highest revenue impact | 10–20% | 70–80% | Never let these stock out. Automate reordering. Prime shelf placement. |
| B Items | Mid-tier, steady sellers | ~30% | 15–20% | Monitor regularly. Reorder on a consistent cycle. Evaluate periodically. |
| C Items | Slow movers, low revenue contribution | 50–60% | 5–10% | Minimize stock levels. Consider phasing out the weakest performers. |
The practical rule is this: automate your A items so they never stock out, and be very discerning about C items that are tying up space and cash your top performers could use. Run ABC analysis at least quarterly, and whenever you’re considering adding a new product, ask yourself what it will displace.
PRO TIP!
Many POS systems can run ABC analysis automatically. If yours doesn’t, export your sales data and sort by revenue contribution. It takes 20 minutes and will change how you think about your entire shelf.
Set Minimum and Maximum Stock Levels and Enforce Them
Par levels are the floor (minimum) and ceiling (maximum) for each product’s inventory. Your minimum is your reorder trigger. Your maximum prevents surplus inventory given your storage constraints.
- Minimum (reorder point): Daily sales velocity × supplier lead time in days + safety buffer
- Maximum: How much you can physically store and sell before your next delivery
These numbers should come from actual POS data. Set them, review them quarterly, and let your system enforce them automatically.
Run Cycle Counts Instead of Full Inventory Audits
A full inventory count is disruptive, time-consuming, and only captures one moment in time. Cycle counts (counting a rotating subset of products on a regular schedule) are more practical and catch discrepancies before they compound.
A sensible cycle count schedule for a c-store:
- Weekly: Tobacco, alcohol, lottery tickets (high value, high shrinkage risk)
- Bi-weekly: Your top 20% of SKUs by revenue (your A items)
- Monthly: Everything else
PRO TIP!
Always compare your physical count against your POS records. If you’re consistently off by 5+ units on the same product week over week, that’s either a theft pattern or a receiving error. Both are worth investigating.
Implement FIFO for Every Perishable Category
First In, First Out means the oldest stock is always moved to the front and sold first. It breaks down constantly in busy stores where the speed of stocking takes priority over the discipline of stocking.
- Train every employee who touches stock
- Use expiration date tracking in your POS to flag items approaching their sell-by date
- Consider markdowns or bundles for slow-moving perishables before they expire rather than writing them off entirely
Use Promotions Strategically to Move Slow Inventory
Discounting slow-moving inventory is an important recovery strategy for all retailers. Effective promotions for c-stores include:
- Bundle slow movers with fast movers: “Buy an energy drink, get a snack bar 50% off” moves both and increases basket size
- Time-limited markdowns on near-expiry perishables: A 30% discount beats a 100% loss
- Tie promotions to local events or weather: These feel timely and relevant to customers (think: cold drinks before a heat wave, hot coffee bundles in winter)
Is inventory management a headache?
KORONA POS makes stock control easy. Automate tasks, generate custom reports and learn how you can start improving your business.
Inventory KPIs Every C-Store Owner Should Track
You can’t manage what you don’t measure. The following KPIS are the metrics that show how your inventory is actually performing. We’ve included benchmarks, so you know where you stand.
← Scroll to see more →
| KPI | What It Measures | Benchmark |
|---|---|---|
| Inventory Turnover Rate | How efficiently you’re converting stock into sales | ~11.8× per year |
| Shrinkage Rate | Inventory lost to theft, spoilage, or error as a % of revenue | 1–4% of revenue |
| Days of Inventory on Hand (DOH) | How many days of stock you have at your current sales pace | 3–7 days for fast movers |
| Sell-Through Rate | % of received inventory actually sold in a given period | 80–95% non-perishables; 95–100% perishables |
| Gross Margin Return on Investment (GMROI) | How much gross profit you earn for every $1 invested in inventory | Higher is better; compare across categories |
| Sales Per Square Foot | How efficiently your physical space converts to revenue | ~$583/sq ft nationally |
| Stockout Rate | How often a product is unavailable when a customer wants it | Under 2% for A items |
Demand Forecasting for Convenience Stores
Demand forecasting means predicting what you’ll sell and when so you have the right inventory ready before customers need it.
The Variables That Drive C-Store Demand
C-store demand doesn’t follow a smooth, predictable curve. It spikes and dips based on factors that are knowable in advance if you’re paying attention:
- Day of week: Friday and Saturday traffic patterns are almost always different from Tuesday. Track sales by day, not just weekly totals.
- Time of day: Morning coffee and breakfast items, afternoon snack runs, late-night impulse purchases: each time of day has its own demand profile.
- Weather: Hot weather drives cold beverages and ice cream. Cold snaps drive coffee, hot food, and hand warmers. Weather is one of the most underused inputs for c-store inventory forecasting.
- Local events: A stadium, concert venue, school, or office park near your store means demand spikes you can plan for. (Know your local event calendar!)
- Holidays and seasons: not just the obvious ones (Halloween candy, Fourth of July) but also the hyper-local patterns, like the week before school starts, or the regional festival.
- Promotions: Your own price promotions and competitor promotions both shift demand. Track what happened last time you ran a similar deal.
PRO TIP!
Keep a simple “demand notes” log in your POS, a shared doc, anywhere. When something unusual happens (a big local event, a competitor closure, an unexpected weather pattern), note it alongside your sales data.
Data-Driven Forecasting
Most c-store operators already do some form of forecasting. The goal is to make it as consistent and repeatable as possible:
- Use at least 12 months of sales data for your top SKUs
- Identify clear weekly and seasonal demand patterns
- Set reorder points based on those patterns (for example, higher bottled water thresholds in August than in January)
- Revisit and adjust quarterly, or sooner if conditions change (new competition, nearby development, or assortment changes)
AI and Automated Forecasting
More sophisticated POS systems now include demand forecasting features that analyze your sales history automatically and adjust reorder suggestions based on trends, seasonality, and even weather data. For operators managing high SKU counts or multiple locations, these tools pay for themselves quickly by reducing waste and stockouts.
Category Management and Planograms
Category management is the practice of organizing your products into categories and making inventory, pricing, and placement decisions at the category level rather than product-by-product.
Core C-Store Product Categories
← Scroll to see more →
| Category | Examples | Inventory Note |
|---|---|---|
| Beverages | Energy drinks, bottled water | Highest velocity in the store — automate reordering |
| Tobacco & Nicotine | Cigarettes, vapes | High shrinkage risk — count weekly, restrict access |
| Snacks | Chips, candy | Large brand variety — audit for slow movers regularly |
| Fresh & Foodservice | Sandwiches, hot food | Needs separate spoilage and waste tracking logic |
| Alcohol | Beer, hard seltzers | Compliance + age verification at every transaction |
| Impulse & Checkout | Gum, lighters | Small items — stockouts are easy to miss |
| Health, Beauty & OTC | Pain relievers, personal care | Low velocity but high value — don’t overstock |
| General Merchandise | Batteries, phone chargers | Highly seasonal — order conservatively |
What Is a Planogram and Why Does It Matter for Inventory?
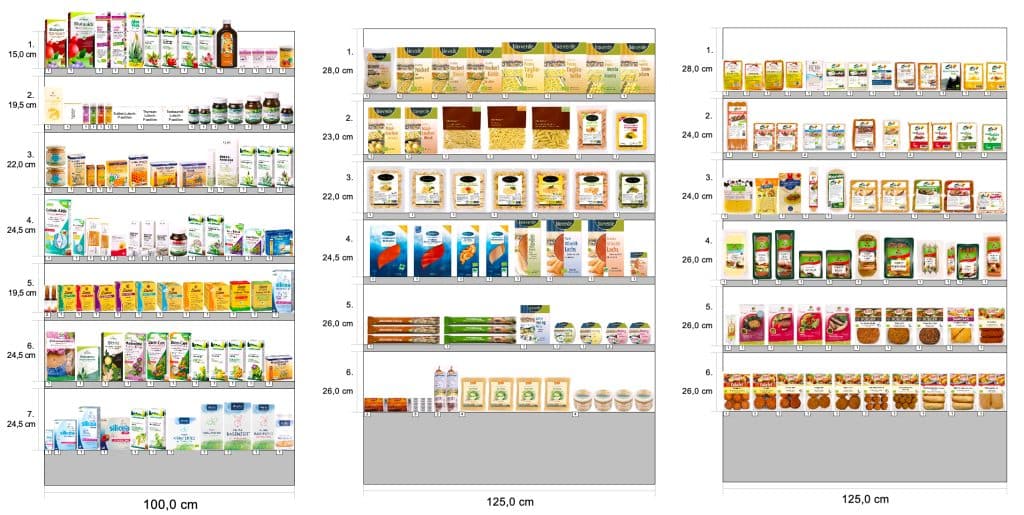
A planogram is a visual diagram mapping exactly where each product sits on your shelves (which shelf, how many facings, how deep). It’s usually thought of as a merchandising tool, but it has direct inventory implications:
- The number of facings determines your physical maximum stock level at the shelf
- Shelf depth determines your buffer between stockout and reorder
- Product adjacency affects which items customers find together, which means a promotion on one product affects demand for its neighbors
When your planogram and your inventory system are aligned, reorder quantities are grounded in physical reality. When they’re not, you end up ordering the “right” amount in theory, but constantly running out because the shelf was never built to hold it.
Using Sales Data to Update Your Shelf Layout
Your POS data is the best planogram input you have. Use it to:
- Test whether moving a product changes its velocity.
- Identify products consistently selling out before your next delivery. They probably need more facings or deeper shelving.
- Find products with low sell-through that are occupying prime shelf space.
Age-Restricted and Regulated Products
Tobacco, alcohol, and lottery tickets are among the highest-revenue categories in most c-stores, and they come with compliance obligations, heightened shrinkage risk, and tracking requirements that are more demanding than anything in your snack aisle.
Scroll to see more
| What to Do | Note |
|---|---|
| Tobacco & Nicotine | |
| Verify age at every transaction | Electronic verification required in many states |
| Count weekly at minimum | Daily spot checks on top SKUs are not excessive |
| Track at the pack level, not the carton | Small gaps caught early stay manageable |
| Keep promo pricing current in your POS | Stale pricing skews margin reporting |
| Alcohol | |
| Log every age verification | Performing the check is not enough — it needs to be on record |
| Build compliance into receiving | State laws vary on limits, hours, and labeling |
| Restrict inventory adjustment access | High-shrinkage category — role-based permissions matter |
| Adjust reorder points seasonally | Holiday and summer demand swings are predictable |
| Lottery Tickets | |
| Treat it like cash | Apply the same controls you would to your till |
| Count weekly, reconcile two sources | Cross-reference POS records against lottery terminal records |
| Restrict and log storage access | Know who touched the tickets and when |
| Apply FIFO to ticket books | Sell older books first, track expiration dates |
Fresh Food and Foodservice Inventory
The c-store industry has been moving toward foodservice for years. Fresh coffee, prepared sandwiches, hot-food programs, and grab-and-go meals now drive significant marginsa at well-run locations. But fresh food inventory runs on completely different logic than packaged goods, and operators who manage both with the same mindset run into problems.
Why Fresh Inventory Is Different
- Spoilage windows are measured in hours. A sandwich made at 6 a.m. has a very different horizon than a bag of chips. Your inventory system needs to track and flag this in real time.
- Waste is a cost of goods. Some unsold fresh food is normal and should be planned for. The goal is to understand your waste rate and build it into your ordering and pricing model.
- Production quantities are an inventory decision. How many sandwiches you make at 5 a.m. is functionally the same decision as how much bottled water you order. Treat it accordingly.
- Fresh and packaged are managed differently. Par levels for perishables need to account for time of day, day of week, and how close you are to your next production window.
Multi-Location Inventory Management
If you operate more than one c-store location, multi-location inventory management gets more complex, but it also gets more powerful, because you can see patterns and move inventory in ways that a single-store operator can’t.
The Challenges of Multi-Location Inventory
- Inconsistent product mixes across locations make benchmarking difficult and supplier negotiations harder
- No visibility into which location is over/understocked on the same SKU until someone notices a shelf gap
- Manual processes don’t scale. What works (barely) at one location falls apart at three
What to Do About It
- Centralized inventory visibility is non-negotiable. You should be able to see stock levels, sales velocity, and shrinkage rates across all locations from a single dashboard at any time.
- Inter-location transfers: When one location is overstocked on a product that another is running low on, you should be able to transfer stock before either situation becomes a problem.
- Location-specific par levels: A downtown location near an office park has different demand patterns than a highway location. Your reorder points should reflect actual local demand rather than a company-wide average.
- Centralized purchasing with local flexibility: Negotiate supplier pricing and contracts at the portfolio level (more volume = better terms), but allow local managers to adjust order quantities within approved ranges based on their specific patterns.
PRO TIP!
If you’re expanding from one location to multiple, this is the single best time to implement a centralized POS and inventory system. Retrofitting multi-location visibility into a system designed for single-store use is painful and expensive. Build the right foundation before you scale.
What to Look for in a C-Store POS System for Inventory Management
Your POS system is the operational backbone of all of the above. Without the right features, most of the best practices in this guide require manual effort that simply won’t happen consistently on a busy c-store floor. Here’s what actually matters.
Real-Time Inventory Tracking
Every sale, return, delivery, and adjustment should update your inventory count immediately. If you’re relying on end-of-day reconciliation or physical inventory counts to know what you have, you’re always working with stale data. Real-time tracking is the foundation on which everything else builds.
Automated Reordering and Order Cycles
Your system should be able to automatically trigger purchase orders when stock reaches your minimum level. It should also be smart enough to account for supplier lead times, not just current stock. Bonus points if it can create recurring order cycles for predictable, high-velocity SKUs so you’re not manually approving the same order every week.
ABC Analytics and Advanced Reporting
The ability to classify your inventory by performance tier and automatically generate reports that surface your best and worst performers is one of the highest-leverage features a c-store POS can offer. Look for systems that make this easy.
Best and Worst Seller Identification
You should be able to surface your top and bottom performers quickly, by category, by time period, and ideally by location. This directly drives decisions about which brands to keep, which to cut, and which new products deserve shelf space.
Role-Based Access Controls
Not every employee should be able to adjust inventory, issue refunds, or override prices. Look for systems with detailed, customizable access controls and full audit trails on every action.
Age Verification Integration
For tobacco and alcohol sales, your POS should automatically prompt for ID verification. Some systems integrate with ID scanners for faster, more reliable verification.
Vendor Management and Purchase Order Tools
The ability to manage supplier contacts, track delivery history, generate purchase orders, and reconcile received inventory against ordered quantities, all within your POS, significantly reduces the administrative burden of inventory management and improves accuracy.
Multi-Location Support
If you have or plan to have more than one location, your POS needs centralized inventory visibility, inter-location transfer capabilities, and location-specific reporting.
Conclusion: Convenience Store Inventory Management Starts With the Right System
The c-stores that get inventory management right are the ones that know their numbers, count consistently, stock intelligently, and use their POS system as a management tool rather than just a cash register. Whether you’re tackling shrinkage in your tobacco aisle, building out a fresh food program, or trying to get ahead of seasonal demand swings, the principles in this guide give you a starting point.
KORONA POS is built specifically for the demands of convenience retail: real-time inventory tracking, automated reordering, ABC analytics, and role-based access controls all in one place, with no add-ons required. Pick two or three things to implement this week. Build from there.
Get started with KORONA POS today!
Explore all the features that KORONA POS has to offer with an unlimited trial. There’s no commitment or credit card required.
Frequently Asked Questions
What is the average profit margin for a convenience store?
Convenience store net profit margins typically run between 1% and 4%, which makes inventory efficiency critical.
How do convenience stores handle inventory for seasonal or limited-time products?
The key is treating seasonal SKUs as temporary A or B items. Give them appropriate shelf space and reorder attention during their window, then phase them out cleanly rather than letting leftover stock sit. Build a clearance or bundle strategy into your plan before the season ends.
What’s the difference between inventory management and inventory control?
Inventory management is the broader strategy: how you order, forecast, categorize, and optimize your stock. Inventory control is the operational side: cycle counts, shrinkage prevention, access restrictions, and reconciliation. You need both.