

Key Takeaways:
- Most retailers evaluate suppliers on relationships and habit, but your POS data tells you which vendors actually make you money and which ones quietly cost you.
- Five metrics do most of the work: gross margin by supplier, sell-through rate, on-time delivery and lead time, stockout rate, and return rate. All of them come straight out of your POS reporting.
- A supplier evaluation is only useful if it happens on a schedule. A quarterly review of your top vendors takes under an hour and catches problems before they compound.
- Evaluation is the first half of the process. Once you know how each supplier performs, that same data becomes leverage in your next conversation with a vendor.
You probably have a sense of which suppliers are good and which ones are a headache. The problem is that a sense can be wrong. A friendly rep who calls back quickly can hide a pattern of late deliveries, and a vendor you have ordered from for ten years can become your least profitable supplier without anyone noticing.
That’s why it’s smartest to use your POS system strategically in your interactions with suppliers. Five metrics from your POS data will tell you nearly everything you need to know: gross margin by supplier, sell-through rate, on-time delivery, stockout rate, and return rate. This guide covers where to find each one in your reports, what it tells you, and how to turn the numbers into a review you can run every quarter.
Why Supplier Evaluation Matters for Retailers
Your suppliers determine your cost of goods, your inventory levels, and how often your shelves sit empty. That makes evaluating them one of the highest-leverage habits in retail. Here is what regular supplier evaluation actually does for your business:
- It protects your profit. Inventory is your biggest expense, and every supplier affects what your products cost you. Knowing which vendors leave you the most profit tells you where to spend more and where to push back on pricing.
- It frees up cash. Products sitting on shelves are money you cannot use. Evaluation shows you which suppliers’ products actually sell, so you stop putting money into slow-moving inventory.
- It prevents lost sales. Late and incomplete deliveries cause stockouts, and every stockout is a sale you never get back. Tracking deliveries tells you which vendors are costing you sales.
- It gives you negotiating power. Vendors negotiate every day, and most retailers do not. Bringing a supplier’s actual track record to a pricing conversation changes who holds the advantage.
- It catches slow decline early. Supplier performance rarely falls apart overnight. It slips a little each quarter, and a regular review catches the slide while it is still easy to fix.
Without a process, supplier relationships run on habit. A vendor you added five years ago for one product line can grow into a fifth of your purchasing without anyone asking whether they earned it, so the numbers are the only honest way to get into control.
Supplier Performance Metrics Every Retailer Should Track
You do not need a purchasing department or separate supply chain software to evaluate suppliers. You need five numbers, and your POS system produces all of them automatically as you sell. Here is what each one measures and why it matters.
Gross Margin by Supplier
Gross margin is the money left over after you pay for a product, and tracking it by supplier is the single most important part of an evaluation. Two vendors can bring in the same sales while one earns you twice the profit, and sales numbers alone will never show you that. Gross margin by supplier tells you which vendors are actually worth their shelf space.
Look at margin as a percentage and as a dollar amount. A specialty vendor earning you 55% on a small amount of sales may matter less than a high-volume supplier earning 30% on ten times the sales. You need both views before deciding who gets more of your buying budget.
Sell-Through Rate by Supplier
Sell-through rate is the percentage of what you bought from a vendor that actually sold within a set period. A supplier whose products consistently sell through at 80% is helping you turn inventory into cash. A supplier sitting at 40% is leaving your money stuck on the shelf.
Low sell-through is not always the vendor’s fault, since your own ordering decisions play a role. But when one supplier’s products keep selling worse than the rest of your store, that pattern belongs in the evaluation. It means their products are not a match for your customers, whatever the reason.
On-Time Delivery and Lead Time by Supplier
Lead time is the time a supplier takes to deliver after you place an order, and late deliveries can lead to empty shelves and lost sales. Tracking average delivery time by supplier turns “they seem slow lately” into a number you can compare across vendors and across quarters.
If your POS imports vendor shipping notifications, you can also catch incomplete deliveries as they arrive rather than discovering them during a stock count. Deliveries that come up short and go unnoticed look like theft or loss in your records and hide how much the supplier is actually failing to ship.
Stockout Rate by Supplier
A stockout is when you run out of a product customers want to buy, and your reports can tell you how often a specific supplier is the cause. Compare your out-of-stock records against the vendors who supply those products. If one supplier keeps showing up, their unreliability is costing you sales, and now you can put a number on it.
Stockout data also tells you when to adjust your reorder settings. If a vendor has gotten slower, you need to reorder their products earlier, or the empty shelves will continue no matter how many complaints you file.
PRO TIP!
In KORONA Studio, reorder levels live under Inventory > Products > Stocks, and adjusting them for a slow vendor is often the fastest short-term fix while you decide whether to keep them.
Return Rates by Supplier
Return rates tell you about product quality. When one vendor’s products come back at twice the rate of everything else you sell, your customers are telling you something about that supplier that no sales rep will. Frequent returns also cost you in staff time, damaged goods you cannot resell, and customers who lose trust in your store.
Track returns by supplier over at least two quarters before drawing conclusions, since a single bad batch can raise the numbers temporarily. A pattern that lasts is different. That is a supplier problem, not bad luck.
How to Track Supplier Performance in Your POS System
Any POS system with supplier-level reporting can produce these numbers, so check what your system already shows before building anything in a spreadsheet. If you run KORONA POS, open KORONA Studio and go to the Evaluations tab, where the Supplier Analysis report does most of the work of a supplier evaluation for you. Instead of calculating anything by hand, you get a ranked comparison of your vendors covering order volume, delivery speed, and profit in a single view.
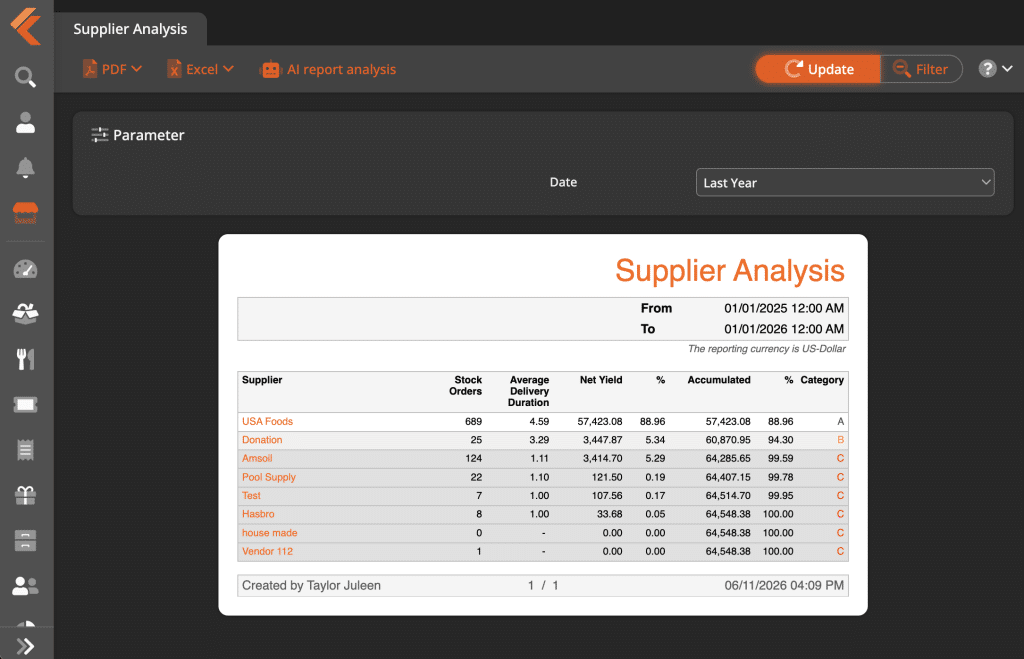
Pay closest attention to the Net Yield column, which shows the percentage of profit each supplier’s products leave you with, and to the performance category KORONA assigns each supplier based on that profit. Pair that with the ABC Analysis report in the same Evaluations tab, which ranks your individual products by how much they add to your sales and profit, so you can see whether a supplier’s whole product line performs or not.
PRO TIP!
Between the Supplier Products report and the ABC Analysis report, a quarterly supplier review takes minutes to pull data rather than hours in manual inventory spreadsheets.
How to Conduct a Quarterly Supplier Performance Review
The numbers only help if you look at them on a schedule, because supplier performance slips gradually and no single week ever feels urgent enough to prompt a review. Put one hour on the calendar each quarter and follow these steps:
- Pull your supplier reports. Open your POS reporting and bring up the supplier-level view covering the past quarter.
- Rank your vendors by profit. Sort your suppliers by how much profit their products earned you, from best to worst.
- Flag anyone slipping. Mark any vendor whose delivery times, stockouts, or returns got worse since last quarter.
- Decide on a response for each flagged vendor. Choose one of three options: raise the issue with them directly, shift some purchasing to an alternative, or keep watching for one more quarter.
- Write down your decisions. Check them against next quarter’s numbers, because the comparison over time is what turns a report into a decision.
Those five numbers, tracked quarter over quarter, are your supplier scorecard. Nothing about the process requires more than the reports your POS already produces and an hour of attention.
When to Switch Suppliers: Red Flags to Watch For
Not every underperforming supplier needs to be replaced, since some problems can be resolved with a direct conversation. But certain patterns rarely turn around. It is time to consider switching suppliers when you see:
- A better alternative you keep declining. If a competing vendor offers similar products and your current supplier performs below your store average on every measure, staying put is a decision too.
- Profit declining for three or more quarters in a row. One bad quarter can be a fluke. Three is a direction.
- Delivery times getting less predictable, even after you raised the issue. A supplier who acknowledged the problem and did not fix it has told you what to expect.
- Return rates staying high across multiple orders. A single bad batch happens to everyone. Repeated batches are a quality problem the supplier is not solving.
- A growing share of your empty shelves traced to their products. When one vendor keeps causing your stockouts, they are costing you sales, not just convenience.
How to Use Supplier Performance Data in Vendor Negotiations
A supplier evaluation should end in one of three outcomes for each vendor: buy more from them, renegotiate, or replace them. Your strongest performers earn a bigger share of your purchasing, which gives you a reason to ask them for volume pricing or first priority when supplies run tight. Your weakest either get a documented, specific conversation about what needs to change, or they get replaced.
Regularly Evaluate Your Vendor Performance with POS Data. Level Up Your Profits.
Nothing in this guide requires new software, new skills, or new spending. With the right POS system, every number you need has been accumulating since the day you opened, generated automatically by the ordering and selling you already do. The difference between retailers who know which suppliers earn their business and retailers who guess is the one hour a quarter spent looking at it.
Start smaller than a full review if that helps. Pull the numbers on your single biggest supplier this week and check whether the vendor that gets the most of your money is actually your best performer. That one comparison usually answers whether the rest of the process is worth your time.
Discover Advanced Analytics and Custom Reports
Speak with a product specialist and learn how KORONA POS can work for your business.
Frequently Asked Questions
How do I evaluate a new supplier before I have any sales data?
Before your POS has a track record to show, you are evaluating on promises, so make them specific. Ask for references from retailers similar to you, place a small first order rather than a large one, and compare what actually arrives against the delivery date and quantities the supplier promised. That first order becomes your first data point, and after two or three quarters the same five numbers in this guide take over.
How do I track supplier performance across multiple store locations?
Compare each supplier’s numbers store by store rather than only as a combined total, because a supplier can perform well at one location and poorly at another due to different delivery routes or regional demand. A POS system that pools sales and delivery data from all your locations into one set of reports makes this comparison possible without merging spreadsheets by hand. The store-by-store view also strengthens negotiations, since it shows exactly where a supplier is falling short.
What is a good sell-through rate for supplier products?
It depends on what you sell, but comparing a supplier against your own store average is more useful than any industry benchmark. If your store sells through 70% of its inventory in a typical quarter and one vendor’s products sit at 45%, that gap is your answer. The number that matters is how a supplier performs compared to the rest of your store.
What should I do before dropping a long-term supplier?
Have one documented conversation first, with specific numbers and a specific timeline for improvement. Line up your replacement vendor before that conversation, so you can genuinely walk away if nothing changes. And check whether any of the problems trace back to your own ordering patterns, because reorder settings that ignore how long a vendor actually takes to deliver will make any supplier look unreliable.