Without accurate, real-time inventory data, it’s easy to lose track of stock, miss out on sales, or tie up money in products that don’t move. That’s where inventory reporting comes in.
In this blog post, we’ll break down what inventory reporting is, why it matters, and the types of reports that can help you boost your bottom line—plus how retail inventory management software like KORONA POS makes it easier than ever.
? Key Takeaways:
- Inventory reports help retailers avoid stock-outs, slow-moving stock, and dead stock by providing insights into inventory levels, sales trends, and product categories.
- Automated reports enhance accuracy and efficiency while reducing the need for manual updates.
- Essential reports include stock levels, gross margin return on investment (GMROI), inventory profitability, and sell-through rate.
- Retail inventory management software, like KORONA POS, offers key features that automate and simplify inventory reporting.
What Is Inventory Reporting?
Inventory reporting refers to the process of collecting, analyzing, and displaying data related to your stock. It includes insight into stock levels, inventory movement, profitability, and turnover rates.
Accurate reports help you make smarter purchasing decisions and avoid costly inventory mistakes.
Pro Tip!
Automate your reports with a POS system like KORONA POS’s retail inventory management software to save time and reduce human error.
How Do Inventory Reports Benefit a Business?

The most successful retail companies are data-driven, and inventory reporting metrics provide a comprehensive and highly accurate view of the business. Here are some of the benefits of inventory reports:
Reduced Stock-outs
Inventory reports, such as inventory forecasting, identify which items are running low before it’s too late. Ultimately, these help reduce stock-out situations, maintain sales, and avoid customer disappointment.
Faster replenishment
Track lead times and automate restocking with real-time data. Speeding up replenishment reduces downtime and boosts your business’s efficiency.
Increased Visibility
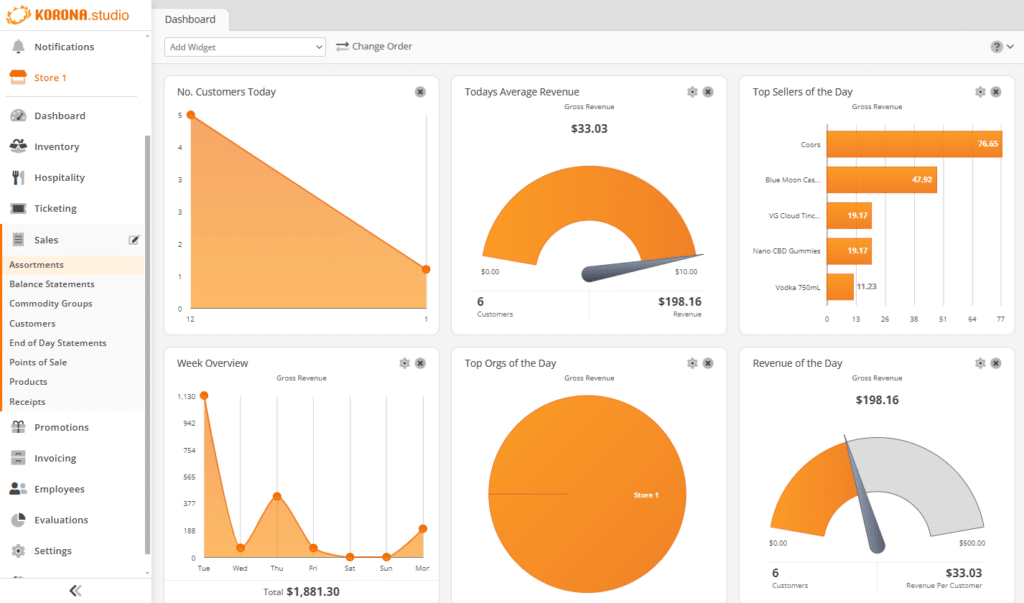
Get a comprehensive overview of what’s in stock, what’s moving fast, and what’s gathering dust. Better visibility = better decisions.
Increased Accuracy
Manual errors are common. With accurate, real-time reporting, you reduce mistakes in stock counts, reorders, and audits.
Quick Note!
KORONA POS‘s shipment tracking feature lets you know when items have been shipped and what’s in them. The system also sends notifications about low stock, overstock, and out-of-stock items. With a single click, you can also get a report card on each item in your product catalog.
Inventory Reports Vs. Inventory Management Reports
While similar, an inventory report and an inventory management report serve different purposes for business.
- Inventory Reports: Snapshots of current inventory levels and statuses, sales, and performance.
- Inventory Management Reports: Offer a broader analysis of inventory practices over time and include metrics like inventory turnover ratios, reorder points, and gross margin return on investment (GMROI).
What Are The Most Important Types of Inventory Reports?
Inventory reports provide a wealth of helpful information, such as useful product details and retail key performance indicators (KPIs). Here are some of the types of reports you can generate with KORONA POS:
Stock Levels
Stock levels reports show current inventory by SKU or product category. In KORONA POS, these track critical inventory levels and trigger replenishment alerts. Ultimately, stock level reports help plan re-stocking and prevent over-purchasing.
Conversion Rates
Conversion rates assess the percentage of customers who make a purchase after interacting with your inventory. With KORONA POS, you can see how often an interested customer makes a purchase to gain insight into your marketing and sales numbers
Gross Margin Return on Investment (GMROI)
GMROI measures how much profit a company’s makes on each dollar invested in inventory. Retailers can use this metric to optimize pricing and focus on the most profitable items.
Inventory Profitability
An inventory profitability report provides a detailed analysis of how well inventory items contribute to your business’s overall profit. It is done in three parts:
- SKU Profitability: Measures the profit generated by each Stock Keeping Unit (SKU), assessing individual item performance.
- List Profitability: Evaluates the profitability of different product categories, such as brands or types.
- Trend Profitability: Tracks profitability over time, providing insights into how profits from inventory items or categories evolve.
Using these product performance analytics can help your brand reduce costs, eliminate dead stock, and increase profits by promoting top-performing items.
Inventory management a headache?
KORONA POS makes stock control easy. Automate tasks, generate custom reports, and learn how you can start improving your business.
Sell-Through Rate
The sell-through rate (SR) measures the percentage of inventory sold during a set time period (usually one month) relative to the amount received from suppliers. A high sell-through rate indicates strong sales performance and inventory management.
With KORONA POS, you can get an overview of the seasonal evolution of your inventory via sell-through rate reports.
Inventory Replenishment
The inventory replenishment report displays stats such as your ending inventory, items sold per day, days of coverage, and average cost. This can help you understand how certain products are selling so you can streamline your supply chain and avoid gaps in stock.
ABC Analysis
ABC analysis classifies inventory into three categories based on their consumption value: A (high-value), B (moderate-value), and C (low-value). This classification helps retailers prioritize the items that matter most.
3 Examples of Inventory Reports
Example #1: Stock Valuation Report
Summarizes the value of a company’s unsold inventory at a particular moment. It’s an important tool for grasping how inventory affects finances and for making smart choices about managing stock.
Example #2: GMROI Report
Details the profitability of each product by comparing gross profit to the cost of inventory. Ideal for trimming underperforming items.
Example #3: ABC Analysis
Categorizes inventory items based on their value or importance to a business. The information from an ABC analysis reduces dead stock and can boost your inventory turnover rate.
Discover Advanced Analytics and Custom Reports
Speak with a product specialist and learn how KORONA POS can work for your business.
How To Build An Inventory Report
While it’s possible to create a basic inventory spreadsheet in Excel or Google Sheets, the best inventory management software make your reporting straightforward, accurate, and valuable. Here’s how to do it:
1. Build a complete list of your products
Start with an up-to-date product list with SKUs, descriptions, cost, and pricing. This forms the foundation of your report.
2. Set your timeframe and stick to it
Choose whether you’re reporting daily, weekly, monthly, or quarterly. Consistency helps track trends over time.
3. Automate your inventory reports
Use software like KORONA POS to auto-generate accurate, real-time reports. Save hours every week and make faster decisions.

Improve Your Inventory Reporting Today with KORONA POS
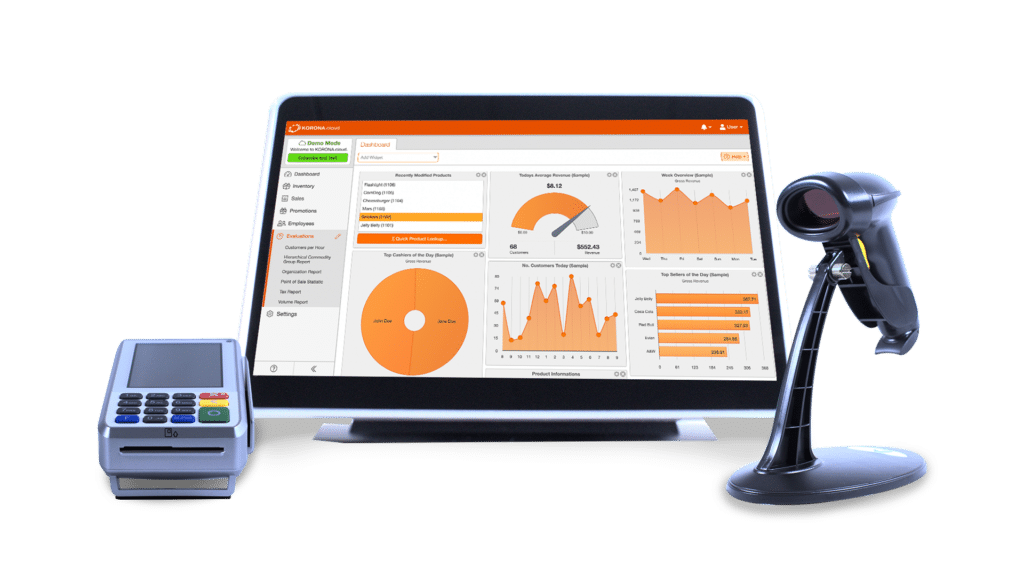
Manual reporting is slow, outdated, and prone to error. KORONA POS automates and streamlines the entire process. With real-time insights and customizable dashboards, you can manage inventory more efficiently and make data-driven decisions, all day long.
Kristen Lee, Owner of the Pine and Peoria Liquor Store
“The most important thing in the liquor industry is inventory management. We buy and sell at such a rapid rate, and product prices increase daily, so it’s important for us to have the right reporting and information. KORONA POS’s inventory reports are all very seamless.
One report that I found helped me calculate exactly what it costs per hour to be open. We were able to compare foot traffic to sales revenue during certain points in the day to decide our store hours.“
Schedule a KORONA POS Demo Today
Speak with a product specialist and learn how KORONA POS can power your business needs.
Frequently Asked Questions (FAQs)
What is the purpose of an inventory report?
An inventory report reveals the amount of inventory a retailer has in stock, which products are selling best, performance by category for specific SKUs, and other insightful information regarding product conditions.
Are inventory reports necessary for my business?
Inventory reports are necessary for both e-commerce and brick-and-mortar businesses. By using inventory reports, businesses can reap better inventory planning, transparent inventory tracking, and organized inventory categorization.
What inventory reports do I need to get started?
Inventory performance and profitability analytics is a great starting point. With these numbers, your company can see its best and worst sales, year-over-year growth, and profitability for each SKU
What’s the difference between manual and automated inventory reporting?
Manual reports are time-consuming and prone to errors. Automated systems offer real-time data, better accuracy, and save time.


