

Key Takeaways:
- ABC analysis categorizes inventory into A (high-value), B (medium-value), and C (low-value) based on revenue contribution.
- Manual ABC analysis is possible but can be complex and prone to errors; automated inventory management software like KORONA POS is recommended for accuracy and efficiency.
- Using ABC analysis improves inventory management by understanding customer demand, increasing sales rates, negotiating better with suppliers, optimizing pricing, and reducing storage costs.
Click through our interactive demo below to learn how to run an ABC analysis in KORONA POS:
What Is ABC Inventory?
ABC analysis is an inventory management technique for identifying your best and worst-performing inventory over time. The approach is based on the Pareto principle (namely, that 80% of consequences come from 20% of cases).
ABC analysis classifies your inventory using three categories (A, B, and C) based on total revenue:
- “A” items – These goods have the highest annual consumption value. “A” items may constitute a small inventory percentage but generate around 80% of total revenue.
- “B” items – These are cross-class items that make up the next 15% of your revenue. Their consumption values are lower than those of A items but higher than those of C items.
- “C” items – This category could have a high percentage of products but low sales values. Category C constitutes the remaining 5% of your revenue and refers to slow-moving or dead stock.
How to Perform ABC Analysis on Your Customers
ABC Analysis categorizes customers based on their value to prioritize resources and optimize inventory management. Here’s how retailers and small business owners can implement it:
Choose the Right Inventory Management Software
Select software like KORONA POS that supports ABC Analysis. It’s considered one of the best inventory management software for small businesses. It should automate data collection, generate inventory reports, and segment customers based on revenue contribution. Ensure it integrates with your POS and provides real-time insights.
Analyze Purchasing Patterns
Use the software to review what A, B, and C customers buy. Identify high-demand products for A customers to prioritize stock. Spot opportunities to upsell to B and C customers.
Tailor Strategies for Each Category
- A Customers: Offer personalized promotions, loyalty rewards, or premium services to retain them.
- B Customers: Encourage higher spending with targeted discounts or bundles.
- C Customers: Use low-cost marketing (e.g., email campaigns) to re-engage or accept lower priority.
Monitor and Update Regularly
Re-run the ABC Analysis quarterly or annually. As customer behavior changes, update categories and adjust inventory or marketing strategies accordingly.
Optimize Inventory
Stock products that align with A customers’ preferences to avoid stockouts. Reduce the overstock of items popular with C customers to minimize carrying costs.
By following these steps and leveraging tools like KORONA POS, retailers can focus on high-value customers, streamline inventory, and boost profitability.
Get started with KORONA POS today!
Explore all the features that KORONA POS offers with an unlimited trial. No commitment or credit card is required.
2 Examples of ABC Analysis of Inventory
Each section highlights an example of how KORONA POS implements ABC analysis.
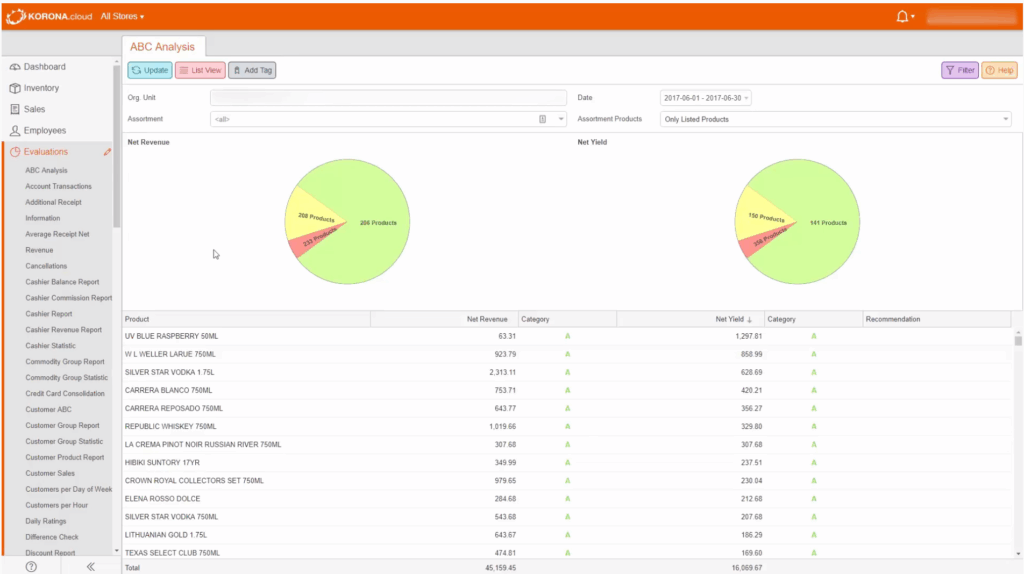
Overview of ABC Analysis
The picture below illustrates the core principle of ABC analysis: categorizing products by their contribution to overall revenue. Products are divided into three categories: A (Green), B (Yellow), and C (Red).
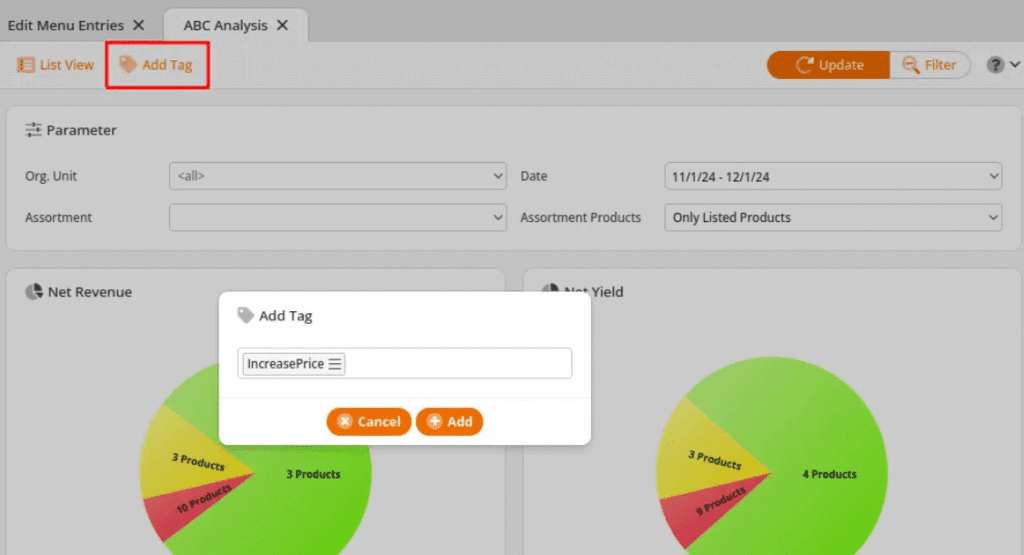
Tagging and In-Depth Analysis
Users can apply tags to products within specific categories by selecting “Add Tag” and choosing from a drop-down menu. This feature facilitates targeted marketing and inventory strategies.
Users can also select a product to open an in-depth analysis report. This report includes:
- Line graphs displaying revenue and net yield over time.
- Graphs showing quantities sold and stock levels.
- Cumulative data on gross revenue, net yield, quantity, and stock.
How to Run an ABC Analysis?
You can run an ABC analysis in two different ways: manually or automatically using inventory management software. The cost of inventory management software depends on your business type, products, size, etc. However, if you want to run your ABC analysis manually, here’s how you can do:
Step 1: Gather product data
Start by collecting data on each product in your inventory, such as sales volume, revenue, or consumption value over a specific period. Include relevant details like product name, unit price, and total sales.
Step 2: Calculate total sales or revenue
Sum up each product’s total sales (or another metric like total consumption). This will help you identify which products contribute the most to your revenue.
Example Data Table for Steps 1 and 2:
| Product Name | Unit Price | Quantity Sold | Total Sales (Revenue) |
|---|---|---|---|
| Product A | $10 | 200 | $2,000 |
| Product B | $5 | 560 | $2,800 |
| Product C | $15 | 100 | $1,500 |
| Product D | $25 | 18 | $450 |
| Product E | $23 | 100 | $2,300 |
Step 3: Rank products by revenue or sales
Sort your products from highest to lowest by total sales (or the chosen metric) to identify your most valuable items.
Example Data Table for Step 3:
| Product Name | Total Sales (Revenue) |
|---|---|
| Product B | $2,800 |
| Product E | $2,300 |
| Product A | $2,000 |
| Product C | $1,500 |
| Product D | $450 |
Step 4: Calculate cumulative percentages
First, calculate your cumulative sales across all items. Then calculate the cumulative percentage for each item. This will help you identify the top products that make up the majority of your revenue. List your products in descending order of percentage of revenue generated.
Example Data Table for Step 4:
| Product Name | Total Sales (Revenue) | Cumulative Sales | Cumulative Percentage |
|---|---|---|---|
| Product B | $2,800 | $9,100 | 31% |
| Product E | $2,300 | $9,100 | 25% |
| Product A | $2,000 | $9,100 | 22% |
| Product C | $1,500 | $9,100 | 16% |
| Product D | $450 | $9,100 | 5% |
Step 5: Categorize products into A, B, and C
Based on the cumulative percentage, categorize the products into A, B, and C. The top items that make up 80% of your cumulative percentage are grade “A” items, your bestsellers. The following 15% consists of grade B items. Anything in the bottom 5% is grade C.
Example Data Table for Step 5:
| Product Name | Total Sales (Revenue) | Cumulative Percentage | Category |
|---|---|---|---|
| Product B | $2,800 | 31% | A |
| Product E | $2,300 | 25% | A |
| Product A | $2,000 | 22% | A |
| Product C | $1,500 | 16% | B |
| Product D | $450 | 5% | C |
Step 6: Review and adjust inventory strategy
Based on your ABC analysis, prioritize high-value (A) products for restocking and promotional efforts, while reducing the focus on low-value (C) products. Adjust your inventory levels, pricing, and supplier relationships accordingly.

How to Implement ABC Analysis Using Technology?
Implementing ABC analysis using technology involves using software tools to categorize inventory based on its value contribution to overall inventory costs. Here’s a step-by-step guide to help you implement ABC analysis effectively using KORONA POS.
The risk of human error in a manual ABC analysis is significant. By using advanced inventory management software such as KORONA POS, you can obtain an automatically generated ABC analysis based on precise, real-time POS data.
Using KORONA POS’s ABC analysis tool, you can:
- Evaluate products based on net income and net yield, with recommendations for categorizing items into A, B, or C.
- Easily stop automatic replenishment for low-performing products and remove them from inventory once sold out.
- Choose from highlighted product names for options like Edit Product, Discount Reasons, Product Report, Products by Day, Recipes, and Inventory History.
Our manual contains more information on running an ABC analysis in KORONA POS. And you can also watch this video for better understanding.
6 Challenges of ABC Analysis
While ABC analysis can help prioritize inventory management efforts, it also poses several challenges that can undermine its effectiveness if not handled carefully. Here are some of the main challenges of ABC analysis outlined and explained below:
1. Data Accuracy and Consistency
ABC analysis heavily depends on accurate sales and inventory data. If the data is outdated, incomplete, or incorrect, categorizing products into A, B, or C classes becomes meaningless.
For example, if sales numbers from the last season are still being used without adjustments for current trends, you may misidentify best-sellers or underperformers.
Small businesses often lack the resources to maintain continuous data cleaning, making this a frequent and costly issue.
2. Static Classification
A major weakness of ABC analysis is that it assumes product importance is static, but consumer demand shifts regularly.
A product classified as “A” today may become less important next quarter due to market changes, new competition, or seasonality.
Without a system for frequent reviews and updates, your analysis becomes outdated, leading to poor stocking decisions and missed sales opportunities.
3. Oversimplification of Inventory Management
ABC analysis categorizes products solely by sales or value contribution, ignoring other important factors such as lead times, supplier reliability, and product lifecycle. For example, a “C” item might have a long lead time but is essential to your offering.
If you deprioritize it because of its classification, you risk stockouts that frustrate loyal customers. In this way, ABC analysis can oversimplify complex inventory needs.
4. Resource Misallocation
The method encourages businesses to allocate most of their attention to “A” items. While this seems logical, it can cause retailers to neglect “B” and “C” items that, collectively, might still contribute significantly to customer satisfaction and brand perception.
For instance, a small but loyal group of customers might rely on certain “C” items — if these disappear, you could lose customer trust and lifetime value.
5. Difficulties in Setting Clear Boundaries
Determining the percentage of products in each category (for instance, 20% A, 30% B, 50% C) can be arbitrary and may not reflect your actual business reality.
Products that fall near the thresholds can be misclassified, which can impact how you prioritize them.
A product barely falling into “B” might deserve “A” level attention, especially if margins or growth potential are better than sales volume suggests.
6. Ignoring Profit Margins
Traditional ABC analysis is based on sales volume or total revenue, not profit margins. High-revenue products might have very thin margins, contributing little to actual profitability.
Small businesses that focus too much on high-volume, low-margin “A” items could struggle financially.
It would miss the chance to boost profits by focusing on lower-volume, higher-margin products undervalued in a standard ABC approach.
Inventory management a headache?
KORONA POS makes stock control easy. Automate tasks, generate custom reports, and learn how you can start improving your business.
Why Use ABC Analysis for Inventory Management?
Many businesses face significant issues with SKU management, along with a wide range of inventory management challenges. Here’s how the ABC analysis transforms inventory management for businesses:
1. Predict demand for specific products
ABC inventory classification helps businesses manage stock by analyzing consumer demand and adjusting inventory based on a product’s life cycle. By tracking market trends, companies can delay the decline of high-demand items and optimize inventory management.
2. Increase sell-through rate
The sell-through rate (STR) is the percentage of your inventory sold to customers. A high STR means your customers enjoy what you’re selling—they’re voting with their wallets.
ABC analysis can help improve your store-wide STR by identifying which products are most popular. You can use the data to schedule upcoming replenishment orders, order less for class C products and more for class A, etc.
3. Better negotiation with the supplier
ABC analysis simplifies supplier negotiations by identifying high-value Category A products that drive the most revenue. With this insight, businesses can focus on securing better terms, such as bulk discounts or flexible payments, for the most essential inventory. This strategy strengthens bargaining power, optimizes costs, and improves profitability.
4. Strategic pricing
ABC analysis helps businesses set strategic pricing by categorizing products based on value and demand. High-priority items (Category A) can be priced for maximum profitability, while lower-priority items (Categories B and C) can remain competitively priced. As demand shifts, businesses can adjust prices accordingly to optimize revenue.
5. Reduced storage costs
Keeping too many items in stock is a costly mistake. Not only are you paying to keep unsold items in storage, but you also incur the opportunity cost of wasted space. Using ABC analysis, you can precisely identify which C-level products are taking up space on your shelf, thus avoiding excess inventory.
ABC Inventory Management Best Practices
1. Embrace technology
Retail merchants can quickly count inventory using a barcode scanner with KORONA POS. Inventory data is automatically imported into the POS system, and users can access an updated ABC analysis with a single click. The software will also provide metrics to measure inventory ROI and help you better strategize your inventory management.
2. Use simple classifications
You can streamline your report by utilizing straightforward inventory classifications, such as revenue generated by product name or category. There is no need to break down each product by color or size right now—you can always do so later with a secondary ABC inventory analysis. That strategy will help you with your inventory valuation.
3. Set Reorder Policies:
- A Items: Low safety stock, frequent reordering, accurate demand forecasting.
- B Items: Moderate safety stock, periodic reordering, regular review.
- C Items: High safety stock, infrequent reordering, simplified processes.
4. Staff training
Staff training and risk mitigation round out the best practices. Employees should understand ABC priorities to focus on high-value A items while following clear protocols for handling, ordering, and auditing each category.
5. Risk mitigation
To mitigate risks, maintain strong supplier relationships for A items to ensure reliable supply, diversify suppliers for B and C items to reduce dependency, and implement cycle counting focusing on A items to verify stock accuracy. Regularly refine the process to adapt to business needs and market changes for sustained success.
5. Regularly Reclassify with Batch Reports
Schedule quarterly or bi-annual batch reports in your inventory software to recalculate item classifications based on updated sales volume and cost. Flag new top-performing SKUs for promotion to A-class. Export the report, sort by updated consumption value, and reapply ABC percentages.
6. Store A-Items Near Packing/Shipping Areas
Keep fast-moving, high-value (A) products close to fulfillment zones to speed picking and reduce handling. Labeled bins, barcode scanners, and shelf identifiers can be used for quick access.
The more I learn to use KORONA POS and the more I work with excellent customer support, the more I believe this POS system could be a very good fit for many types of businesses. What I love the most about this software is the 24/7 customer service and reporting function, which are very easy to use.
-Kevin L.
Streamline Your Inventory Management With KORONA POS
KORONA POS is designed for retailers of all sizes and provides real-time inventory tracking, automated stock alerts, and detailed retail sales analytics to keep your business running smoothly. Features like ABC analysis, multi-location inventory control, and customizable reporting help you optimize stock levels, reduce waste, and increase profitability.
Whether managing a single storefront or a complex retail operation, KORONA POS provides the tools to stay ahead and make smarter inventory decisions.
Get started with KORONA POS today!
Explore all the features that KORONA POS offers with an unlimited trial. No commitment or credit card is required.
FAQs: How To Run ABC Analysis
How do you conduct an ABC analysis?
To conduct an ABC analysis, categorize your products based on their annual consumption value and revenue contribution. Rank them from highest to lowest, with Category A representing the most valuable items, followed by Category B, and Category C for the least useful.
How do you do an ABC analysis in Excel?
To do an ABC analysis in Excel, first list your products along with their sales or revenue data. Then, sort the products by value, calculate the cumulative percentage of total value, and categorize them into A, B, or C based on their contribution to overall sales or revenue.
What is the first step in doing ABC analysis?
The first step in doing ABC analysis is gathering product data, including sales, revenue, or consumption values over a set period.