


Key Takeaways:
- A daily sales report captures net sales, transactions, payment reconciliation, and category performance in one document your team fills out at close.
- Our free template includes built-in formulas for average transaction value, percent of target, and cash over/short, plus a weekly tracker tab.
- The report only earns its keep if someone acts on it: the review habit matters more than the format.
- A spreadsheet works well for a single register, but multi-register and multi-store operations outgrow it quickly and should automate through their POS reporting.
A daily sales report tells you in five minutes what happened in your store today: what you sold, how customers paid, whether the money in the drawer matches your sales, and how the day stacked up against your target. Done consistently, it becomes the earliest warning system you have, catching missing cash, slow-selling products, and scheduling problems days or weeks before they show up in your monthly numbers.
This post includes a free template you can download and start using at tonight’s close, a walkthrough of how to fill it out in under ten minutes, and the seven metrics worth tracking daily. It also covers the honest cutoff point where a spreadsheet stops making sense and automated POS reporting takes over.
Download the Free Daily Sales Report Template
Download a Free Daily Sales Report Template
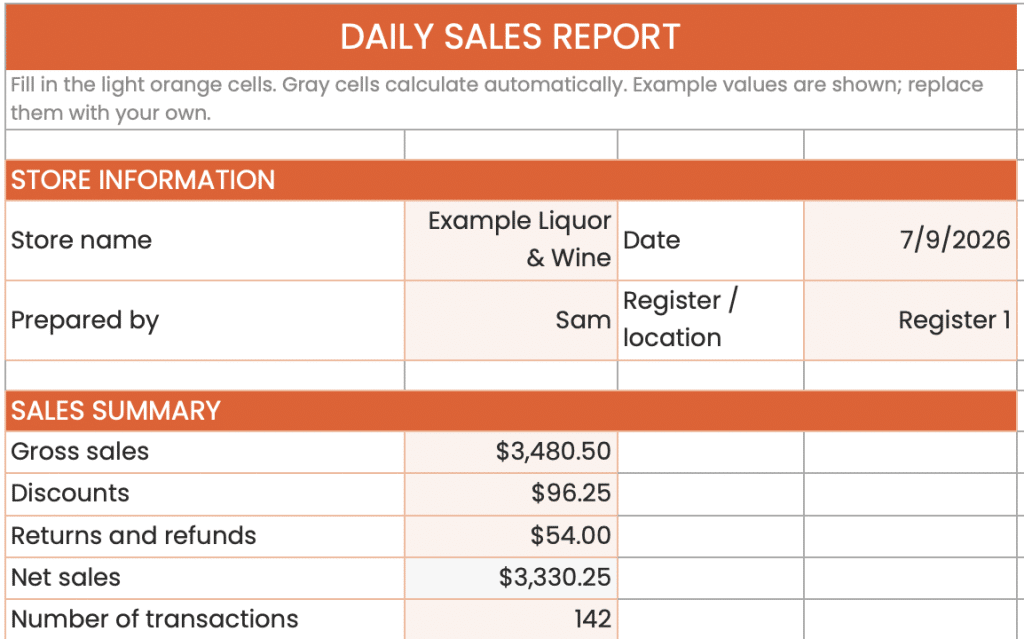
The template has two tabs. The Daily Sales Report tab covers store information, a sales summary, a payment breakdown that checks your drawer count against your sales, sales by category, top five products, employee performance, and a notes section for anything unusual. The Weekly Tracker tab rolls each day’s net sales and transactions into a running week with automatic totals and a comparison against your targets.
Formulas are built in, so net sales, average transaction value, percent of target, the amount your drawer is over or short, and category percentages all calculate automatically. Fill in the light orange cells, and the gray cells do the math. Example values are preloaded so you can see how a completed report looks before replacing them with your own numbers.
How to Fill Out the Report in Under 10 Minutes
The report works best as the last step of your closing routine, built directly from your register’s end-of-day numbers. The sequence looks like this:
- Run your end-of-day report (often called a Z-report) from your register or POS
- Enter gross sales, discounts, and returns in the sales summary
- Count the drawer and enter cash, card, gift card, and tax figures in the payment breakdown
- Check the over/short line, which shows whether the drawer has more or less cash than it should, and investigate anything beyond a few dollars before anyone leaves
- Fill in category totals and top products from your POS category report
- Note anything unusual: voids, comps, weather, a promotion, a register issue
Consider Sam, who closes his liquor store every night. His over/short line ran $40 short two Thursdays in a row, and because the notes section showed the same closing crew both nights, he found a training gap in how returns were being rung up before it became a habit. That is the entire point of the daily report: problems surface while they are still one sentence in a notes field.
PRO TIP!
Review yesterday’s report every morning before the store opens, not at the end of the week. A stack of seven unread reports is data collection, and a single read report is management.
7 Metrics That Belong in Your Daily Sales Report
Total Sales Revenue
Total revenue is the day’s headline number, and the template splits it into gross sales, discounts, and returns so you see net sales rather than a flattering gross figure. Comparing net sales against your daily target turns an abstract monthly goal into a number your closing shift can actually influence.
Average Transaction Value (ATV)
ATV divides net sales by transaction count, and the template calculates it automatically. A rising ATV means customers are spending more per visit, a sign that your add-on selling or product mix is working, while a falling one is a signal to look at your prices or product displays. For a deeper breakdown of this and other benchmarks, see our guide to retail metrics and KPIs.
Sales Per Square Foot
Sales per square foot measures how hard your space is working, and it matters most when comparing departments or locations against each other. It moves slowly, so most stores track it weekly off their daily numbers rather than reacting to a single day. Our sales per square foot calculator covers benchmarks by store type.
Sales by Department or Category
Category breakdowns show where the day’s revenue actually came from, and the template calculates each category’s share of net sales automatically. Watching those percentages day over day reveals shifts, like beer creeping up while wine slides, early enough to adjust orders before the trend costs you.
Employee Sales Performance
Per-employee sales and transaction counts identify your strongest sellers and your training opportunities without waiting for a monthly review. The template computes each person’s average transaction, which is often more revealing than raw sales, since it separates high-traffic shifts from genuinely stronger selling.
Gross Profit Margin
Revenue without margin is a vanity number, so pairing daily sales with your gross margin shows whether a big day was actually profitable or just heavily discounted. Tracking margin daily requires product cost data that is clumsy to maintain in a spreadsheet, which is one of the first signs a store is ready for POS-level reporting.
Returns and Exchange Rate
The share of transactions that come back tells you about product quality, staff accuracy, and customers taking advantage of your return policy faster than any other metric. A single day’s spike usually means one bad batch or one confused employee, and the notes field is where you record which one it was. Our return policy template covers the policy side.
When to Move From Spreadsheet to Automated Reporting
The honest answer is that this template is a starting point, not a destination. A spreadsheet works well for one register and one location, but every additional register multiplies the manual entry, and every additional location multiplies the chance that someone skips a night. When the report stops being filled out consistently, it stops being useful at all.
A retail POS system generates the same report automatically from transaction data, with no typing mistakes and no depending on whether the closer remembered. KORONA POS includes more than 50 customizable reports that cover everything in this template plus margin, inventory, and multi-store comparisons in a few clicks. The template teaches you which numbers matter, and automation makes sure you get them every single day.
Is a Daily Sales Report Worth 10 Minutes Every Night?
For a single-location store, yes, and it might be the most valuable ten minutes of the day. The report catches cash discrepancies while the shift that caused them is still identifiable, and it builds the day-by-day record that makes every bigger decision, from ordering to scheduling to hiring, an informed one. Download the template, run it for two weeks, and if filling it in starts feeling like busywork, that is your signal that your store has outgrown spreadsheets, not that the habit was wrong.
Get started with KORONA POS today!
Explore all the features that KORONA POS has to offer with an unlimited trial. There’s no commitment or credit card required.
Frequently Asked Questions
What is the difference between a Z-report and a daily sales report?
A Z-report is the raw end-of-day summary your register or POS produces, showing totals since the last reset. A daily sales report is the management document built from it, adding reconciliation, targets, category context, and notes, so the Z-report is the source and the daily report is the analysis.
How long should you keep daily sales reports?
Keep them at least three years to satisfy IRS rules for business sales records, and many accountants recommend seven. Digital copies count, so a dated spreadsheet file or POS export archive satisfies the requirement without a filing cabinet.
Should online sales be included in the daily report?
Yes, but tracked as their own line rather than blended into store totals. Mixing the two hides problems in both, since a strong online day can cover up a weak in-store day, and separating them keeps each one’s trend honest.
Who should fill out the daily sales report?
The closing manager or shift lead, as the final step of the closing routine while the drawer count is fresh. Ownership matters more than title: one named person per shift ensures the report actually gets done, and the owner or GM should be the one reading it the next morning.